ORH_wxman
-
Posts
90,892 -
Joined
-
Last visited
Content Type
Profiles
Blogs
Forums
American Weather
Media Demo
Store
Gallery
Everything posted by ORH_wxman
-
Was that the March storm this year?
-
This one was the cause of an epic Kevin meltdown....MLK weekend massacre 2010
-
I reall wish that site went back to March 2001....that gradient would have been even more ridiculous....you had 40+ in ORH county and almost nothing in SE MA.
-
-
How many events recently have we had like 0C 925mb temps at the onset? Having a semi-real airmass over Quebec into NE would help....which has been like pulling teeth the last few seasons...and it was especially comical last season when getting a Scooter high was like trying to get NBC to stop showing Taylor Swift in the luxury suite. Goes back to some of the regional analysis I was doing with the temp anomalies when we break down the last few decades into subsets.
-
Congrats ACK/MVY this year based on SSTAs?
-
Easy to torch on NE winds when the nearest high pressure is over the Flemish cap. Get us some highs north of CAR that feed down some legit dewpoints and lets try it again.
-
I think a lot of people have an unrealistic view of the past when it comes to winter wx. It certainly was colder, but it wasn't Quebec City either and the snow climatology was not 1925 BOS being equal to present day ORH or even present day BED....and a lot of the warming doesn't manifest in cyclogenesis anyway....rather in the milder patterns intruding into the region during more unfavorable hemispheric longwave setups and in radiational cooling spots during calm nights. CC really needs to be thought of in terms of probability on the tails which usually makes people's eyes glaze over, so I understand why its often dumbed down for the masses. But what it really means is that we've increased the chances of record warm events but this does not magically eliminate natural variability either. There's a reason we had our coldest month of all time in 2015 after over a century of CC....natural variation still is the dominant player on smaller timescales such as months and seasons. But when you get a canonical warm pattern, CC helps that become more likely to be record warmth versus 100 years ago.
-
Yeah maybe the Mar 13-14 storm last year is snowier into ORH city (huge gradient right there) in the days of yore....skeptical about it getting awesome much further east because of that nasty nipple low in CT driving those 925s inland, but maybe perhaps to 495ish could've seen 6-10" instead of mostly sloppy 3-6.
-
I will say CC was probably a statistically significant, but still relatively trivial factor in how last season played out. Unless (as I asked this question in the main forum) we believe that all of the sudden regional anomalies such as the Pacific warm blob (2013-2015) and -AO pattern from melting sea ice (2009-2013) are not going to be transitory this time around and New England is just semi-permanently being stuck as the warmest region in the CONUS relative to average for the foreseeable future.
-
Octorcher or Roctober 2023 Discussion Thread
ORH_wxman replied to Damage In Tolland's topic in New England
Xmas 2021 was kind of cold too...lot of ice that morning after the little Xmas eve snow event. Maybe we can go 3 in a row that isn't a torch. -
Octorcher or Roctober 2023 Discussion Thread
ORH_wxman replied to Damage In Tolland's topic in New England
Perfect October weather. Gonna lose it though this weekend and that might be all she wrote. Longer range looks a lot colder. -
'01-'02 and '11-'12 are terrible ENSO analogues. '01-'02 at least was coming off a 3-year La Nina like this year was, but it was a neutral ENSO year whereas we're gonna in a potent El Nino this winter. That doesn't mean the sensible wx can't be similar, but it would probably be for different reasons than those two winters.
-
Yeah and '77-'78 is a brutally cold analog that is unlikely to repeat on temps...though '14-'15 was basically the same DJFM temps as '77-'78...but that was also an extreme season. If we somehow return to a +PNA pattern that coincides with some arctic blocking, then we're gonna get cold for a time. We just haven't really seen that type of pattern in any type of sustained fashion since 2014-15 save maybe maybe Dec 2017/early Jan 2018 and Jan 2022....we had some shorter stints in Dec 2020 and 2nd half of Jan 2019 that helped cause the record breaking cold outbreak that month, but these have been the exception rather than the overwhelmingly -PNA rule with lower arctic blocking.
-
Yes, I find the evidence that MEI won't get close to super Nino status quite compelling. Still a small sample size, so I wouldn't rule it out entirely, but it does seem like it's going to be a moderate to maybe strong MEI at the peak rather than super. Weaker MEI could manifest in the pattern any number of ways....hopefully it's to our advantage. A somewhat stronger northern stream influence with still a decent STJ would probably be a best case scenario (ala a winter like '77-78)
-
Just make sure the setups are exactly the opposite of last year....lol. Didn't even have a weak high over Nova Scotia....instead they were chilling out over the Andrea Gale
-
Yeah there was basically no high.
-
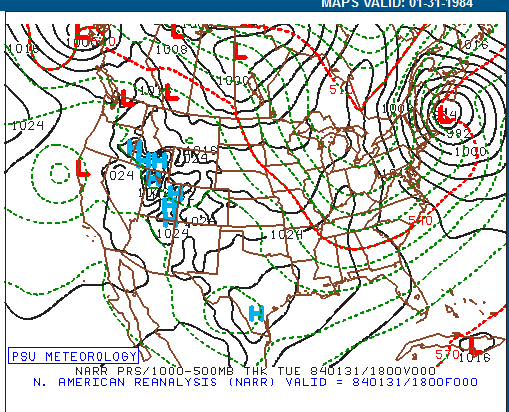
Feb 28-Mar 1, 2005....lol. I hated that one...prob some convective feedback robbing us and that was probably possible because of weakish fronto dynamics. 12/29-30/2012 was one too....kind of fast moving, no great high. But it was a mundane warning event. Low went sub-984 as it crossed BM to east of CHH. 1/31/84 is a good one too...not quite 984mb, but it went sub-990mb. Mundane event.
-
After several solid gains on the weekend, it is now safe to call the NSIDC area minimum....the minimum was set back on 9/12 at 2.63 million sq km. This ranks as the 4th lowest minimum behind 2012, 2016, and 2020. This is 470k below my prediction of 3.1 million sq km and outside my confidence intervals of + or - 300k. You can ironically see in the post above that I said if we matched the record melt after July 1st that occurred in 2016, we'd end up with a min at 2.65 million sqkm....well, we not only matched it, but slightly exceeded it. 2023 is the new record high ice loss after July 1st which blew up my prediction. This is my first real miss since 2016 when we had a similar post-July 1st melt. The odds of a huge post-July 1st melt hadn't really changed much over time based on the empirical data prior to this season, but I might incorporate a very slight handicap in that direction during next year's prediction....though even a slight handicap would not have saved this year's prediction. That is just the nature of trying to use 300k error bars when your standard deviation on this is 375k. So I'd expect to miss about 30-35% of the time using pure statistics....but I usually incorporate medium range weather patterns and also the distribution of the ice into the predictions as well which historically has helped make the misses less frequent than the purely statistical 30-35%. The extent minimum looks like it was around 4.25 million sq km which is barely still inside my confidence interval on extent. A very warm blocky pattern on the North American side was the main culprit in the strong post-July 1st melt. Typically, this area from the CAA to the Beaufort side of the CAB struggles to melt down if there isn't a lot of preconditioning in May/June, but this year we able to overcome mediocre preconditioning with the very strong blocking pattern that set up in July and August.
-
Are you talking about a 984 low on the BM where it was too warm for snow? That happened almost exactly in the 2/24/98 storm. Though you asked about early February and that is late February. I don't think there's been too many, 2/10/10 was basically a sub-980mb sitting on the BM but that brutal northern edge ate into our precip and we got that massive bust. It was cold enough, but the truly heavy precip never made it to us.
-
Yeah I'd sign the dotted line right now if the MEI came in between 0.5-1.0 for the winter. Honestly, the weenie scenario is the MEI keeps lagging in that 0.5 range into December so we get less El Nino influence that month (thus helping the chances for colder/snowier solutions) and then it climbs more for Jan/Feb so we can get the great second half that often occurs with +ENSO. But my guess is still a mild December for now...I think the MEI will rise a decent amount over the next 2 months.
-
Since I was comparing two sets of years against the same anomaly, it wouldn’t change anything on that plot I posted if we changed the baseline from 1991-2020 to another 30 year set. But if we compared one of the sets of years to a single baseline, then yes, it would change depending on the baseline we use. It is easier to get a below normal winter using 1991-2020 normals than using 1961-1990 normals since the latter is a much colder climo baseline.
-
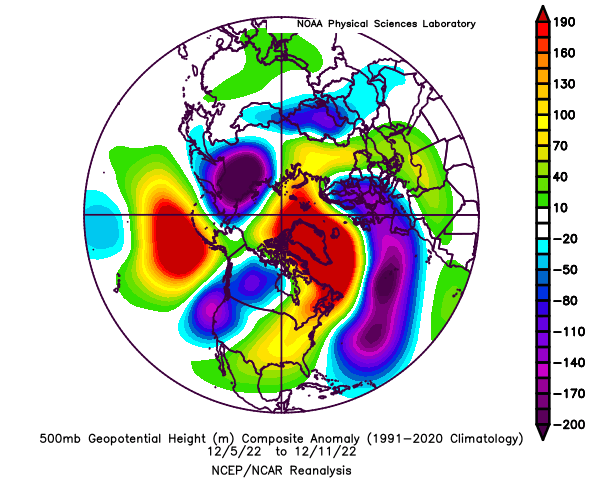
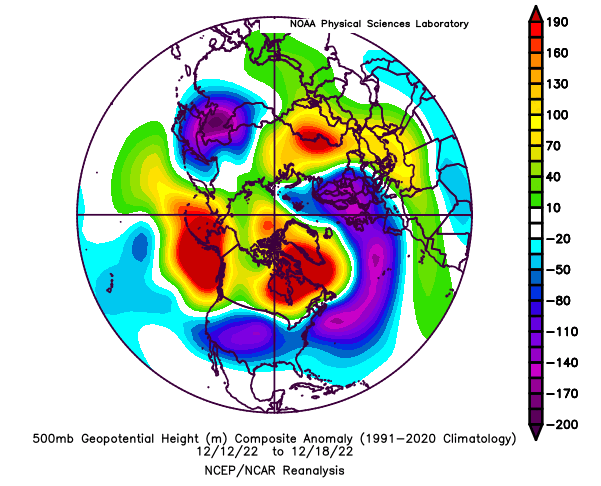
I'd also say it is probably worthwhile to take a look at the evolution of the Dec 2022 block....as noted, you see the initial super deep PNA trough out west producing a huge ridge response in the east in the 7 day period leading up to the maturity of the block. Then as the block is starting to mature, we see a pretty typical height response underneath it....albeit, still some very deep height anomalies over the SW US. Then finally, the fully mature and beginning of the decay of the block in the 7 day period leading into Christmas....you'll note the height response still looks very good to the south, but that core of best anomalies is a bit too far west....did the block cause that or was it the very deep height anomalies in the SW US that led to this? OR maybe it was some of both? Hard to say for sure, but it was not a completely normal evolution given the extreme initial troughing out west.

-
We actually had a discussion about 6-8 years ago on here (I'll have to see if I can find the exact thread) about how the deeper interior had been seeing declining snowfall (particularly bigger storms) while closer to the coast had seen increasing snowfall and the culprit or explanation given at the time by many in the thread was because of the predominantly -AO/-NAO patterns we had seen in recent winters.....due to? You guessed it, lower sea ice/AGW. Now we're seeing the opposite argument....deeper interior is cleaning up because of AGW-induced blocks further south. This is what causes so much skepticism in the pattern-attribution studies....it sounds a lot more like "Flavor of the month" because they don't maintain their dominant force for more than a few winters. I have no doubt that all else being equal, there is some attribution going on, but the problem is things don't remain equal for very long. Natural variability is still a very strong force which is why you can see a decade (or more) of colder winters over a large region than the previous decade despite underlying warming trends. If you adjusted your winter forecast temps much warmer in the 2000s/early 2010s because of the big warming trend we saw from 1980-2000, you would have looked like an idiot and been consistently too warm. Is it because climate change didn't exist? Nope...it was because you probably placed too much weight on it and not enough on other factors that easily overwhelm it in a given season.
-
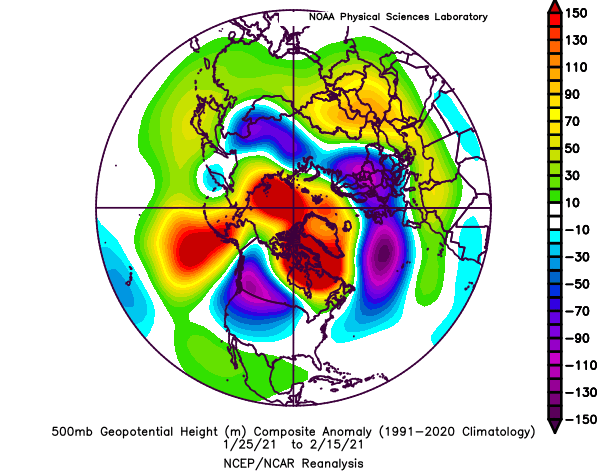
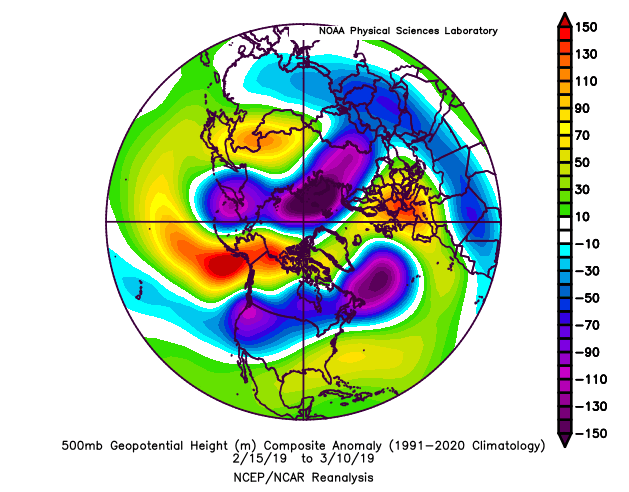
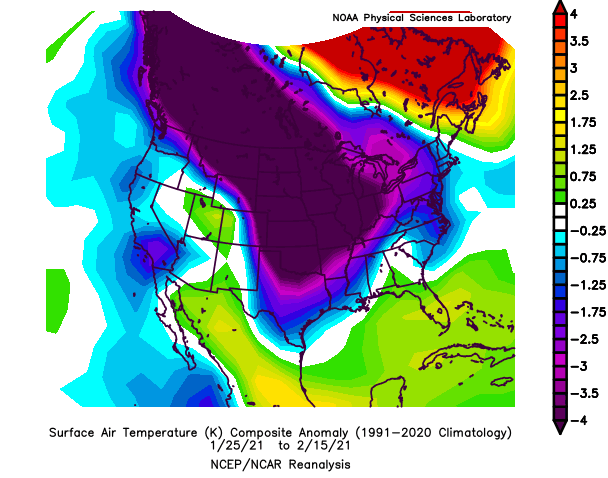
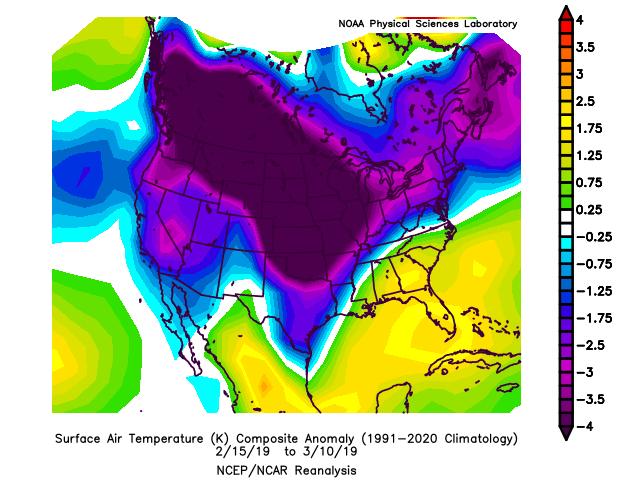
FWIW, here's the 2021 and 2019 patterns I was referring to And the temp anomalies: