WesternFringe
-
Posts
1,131 -
Joined
-
Last visited
Content Type
Profiles
Blogs
Forums
American Weather
Media Demo
Store
Gallery
Everything posted by WesternFringe
-
No response to my post responding to your failed attempt at calling me out? Lol
-
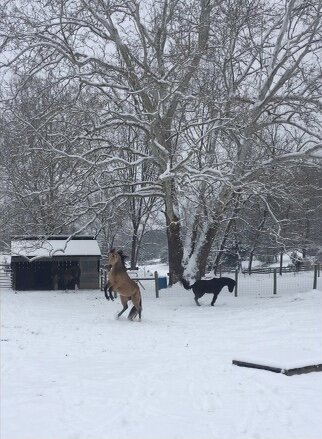
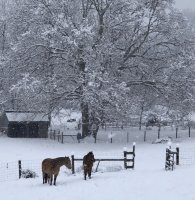
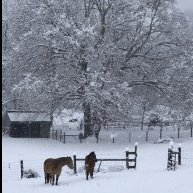
It snowed all day here starting at 10:00 am until sundown and then more overnight on 3/12. It was awesome!! I spent most of the day outside. Went on a Jebride on my atv. Sledded with the kids. Had a fire going in the wood stove. Had about 4” fall that day and overnight, although the roads didn’t get too bad because of ground temps. Had some time off of school for the kids and my wife and I (we are teachers) the next day, which was much needed. I posted pics in the morning that day in the observation thread. Sorry you had nothing in your area and saw no snow when you got home. Nice try at rubbing it in @IronTy, but you picked the wrong guy and failed! Lol I invited you out to the highlands (elevation is cool) but you never showed up! Lolol
-
Is it a bad sign for snow prospects when you can't tell the difference between the long range thread and the futility thread? lol
-
I received a few inches above climo that winter, so the blocking helped at least some of us in this sub.
-
28° and flurries on my way home from my second job here northwest of Staunton
-
35 degrees and flurries intermittent all day here NW of Staunton.
-
It snowed nearly all day today, from 10:00 to sunset. That was awesome.
-
Went on a Jebride on my atv. Lots fell today and even though there wasn’t a ton of accumulation, it was a beautiful day!
- 589 replies
-
- 17
-

-
30° and snowing here northwest of Staunton. Accumulating only on trees and other elevated surfaces at the moment. eta: Starting to accumulate on the ground. Will update with pictures as the day progresses.
- 589 replies
-
- 12
-
-
My sister lives north if Albany. They didn’t do well early in the season, but are making up for it now and look to end with more snow than climo. Snowing here in Augusta County right now!
-
 Let bring this sloppy inch home
 -
I would create a thread for the ten of us that live out this way, but then we would get predominantly cold rain once again lol. @Buddy1987is looking like he lives in a good spot for this wave
-
Hello! I am at 1540’ but have some topographic lifting that helps me and tend to do well for my elevation. Expecting 2”-5” in my county falling from the sky by looking at modeled snowfall but only maybe 1”-2” accumulating looking at snow depth change maps. Rates should be fairly heavy considering the whole event is not very lengthy.
-
Yeah, my sister who lives north of Albany (Halfmoon/ Clifton Park) is just reaching climo of 60” and is modeled to surpass that easily with the upcoming storms. Must be nice!
-
Do you think it is cold enough to snow? Could you clarify? Lol. Jk Looks and feels cold enough out here again finally for snow in Augusta County. Most models and forecasters saying to expect amounts in the 1-3” range. If I get 3”, it will triple my 1.5” total for the season and I will be ecstatic. What a winter!
-
Looking good for the western (and NW) parts of the subforum. 6Z GFS has 4 waves in the next 13 days that bring frozen out here.
-
Most folks are 18 times bitten, twice shy! Lol I am all in on these waves in the next two weeks, though. Why not? It is the best look we have had all winter, so it doesn’t make sense to quit tracking now. After that, I am out and hoping for warm weather and outdoor time.
-
March Medium/Long Range Thread: The Empire Strikes Back
WesternFringe replied to stormtracker's topic in Mid Atlantic
Still drops about 6" here in Augusta County but in a completely different way than the GFS just did. This will be interesting to track! -
March Medium/Long Range Thread: The Empire Strikes Back
WesternFringe replied to stormtracker's topic in Mid Atlantic
Wave 1 for Friday on the 12Z GFS is a 3-5” overrunning event for us western VA folks in Augusta County. Would quadruple mby snow total for the winter! Lol -
March Medium/Long Range Thread: The Empire Strikes Back
WesternFringe replied to stormtracker's topic in Mid Atlantic
Yeah, CMC much improved with the ULL pass. Probably need even souther, but a definite improvement vs 00Z: -
March Medium/Long Range Thread: The Empire Strikes Back
WesternFringe replied to stormtracker's topic in Mid Atlantic
You keep saying that -
March Medium/Long Range Thread: The Empire Strikes Back
WesternFringe replied to stormtracker's topic in Mid Atlantic
Would be quadruple the amount of snow we have had all season in Augusta Co. I take lol -
March Medium/Long Range Thread: The Empire Strikes Back
WesternFringe replied to stormtracker's topic in Mid Atlantic
Are you okay? -
March Medium/Long Range Thread: The Empire Strikes Back
WesternFringe replied to stormtracker's topic in Mid Atlantic
The op is like one high resolution member of the ensemble at day 8. And the mean of all the members outperforms any one member at these leads. -
March Medium/Long Range Thread: The Empire Strikes Back
WesternFringe replied to stormtracker's topic in Mid Atlantic
He's more into analysis than calming weather weenie lemmings that jump off of a cliff every 200 hr op run. lol

