Cobalt
-
Posts
4,908 -
Joined
-
Last visited
Content Type
Profiles
Blogs
Forums
American Weather
Media Demo
Store
Gallery
Everything posted by Cobalt
-

Late February will be rocking. February Long range Discussion thread
Cobalt replied to Ji's topic in Mid Atlantic
Apparently so
-
Late February will be rocking. February Long range Discussion thread
Cobalt replied to Ji's topic in Mid Atlantic
Every dud winter has some sort of gut punch suppressed snow bomb..
-
Late February will be rocking. February Long range Discussion thread
Cobalt replied to Ji's topic in Mid Atlantic
I'll have to dig up the thread but this setup also resembles storm in very late January 2017 (Jan 21st?) that relied almost exclusively on the ULL pass for heavy wet snow.. that one only really ever delivered for favored areas, and in very meager amounts at that. -
Late February will be rocking. February Long range Discussion thread
Cobalt replied to Ji's topic in Mid Atlantic
This isn't any better either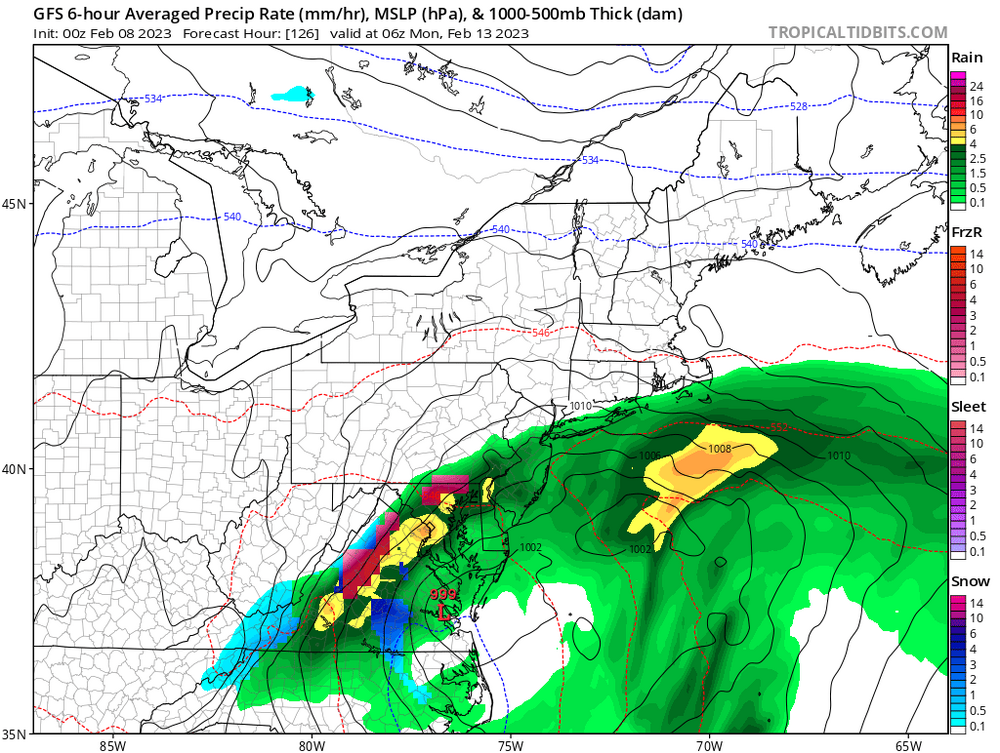
-
Late February will be rocking. February Long range Discussion thread
Cobalt replied to Ji's topic in Mid Atlantic
As the GFS depicts it, this setup seems akin to a warmer Jan 2011.. WAA that flips to rain that becomes heavy as the ULL gets going, then dumping snow as the ULL passes (all at 32-34F). The main difference is that the Jan 2011 setup had some solid west coast ridging and blocking before the storm, and ofc it's a synoptic anomaly. -
Late February will be rocking. February Long range Discussion thread
Cobalt replied to Ji's topic in Mid Atlantic
12z UKIE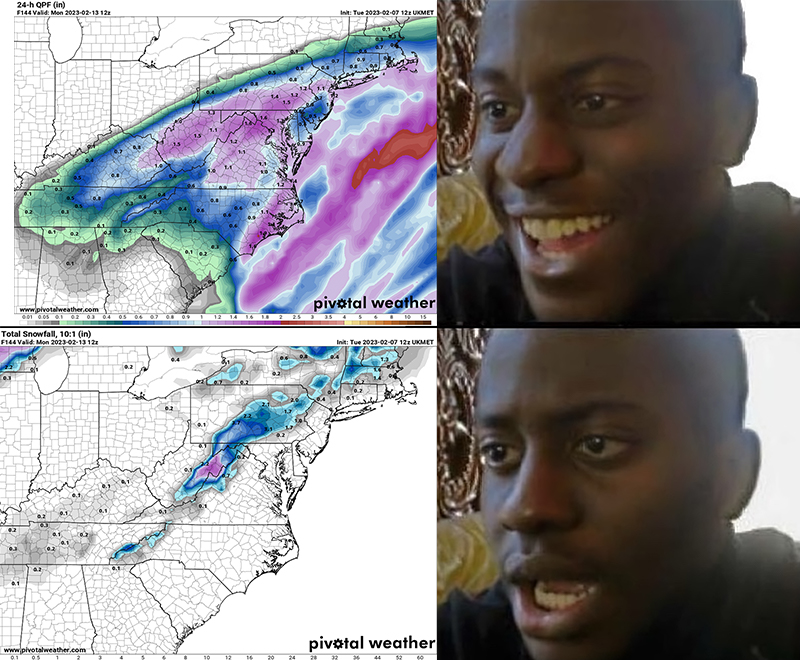
-
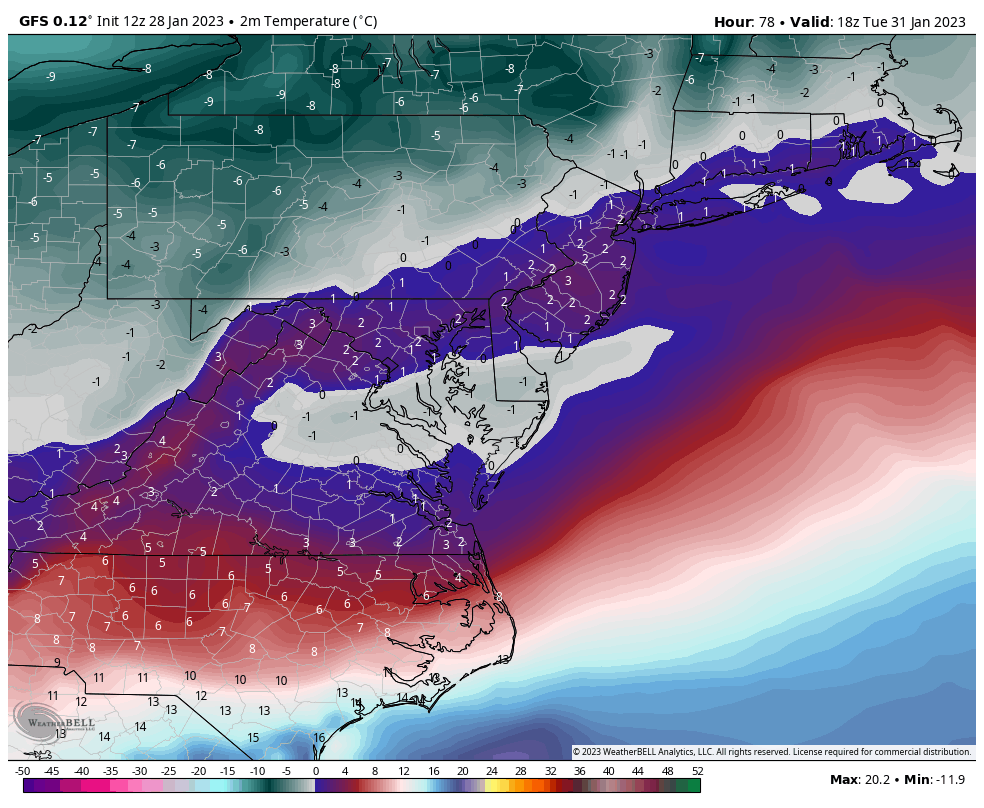
It is quite the weather extreme, considering that Mt. Washington reached this mark shortly after scoring the 2nd warmest first two months of winter on record. Considering how this upcoming month is slated to be much AN following the extreme (but brief) 2 day cold snap, it is plausible that the site achieves both its warmest winter and coldest wind chill temperature in the exact same season. I'm not sure what your definition of "extreme" is, but that doesn't seem like something that happens every year.
-
Easy to forget that DCA had a stretch of something close to 1,000 days without getting below 22F.. we've bottomed out below that mark 4 times so far this winter, and it looks like we're about to do it a 5th time.. yay?
-
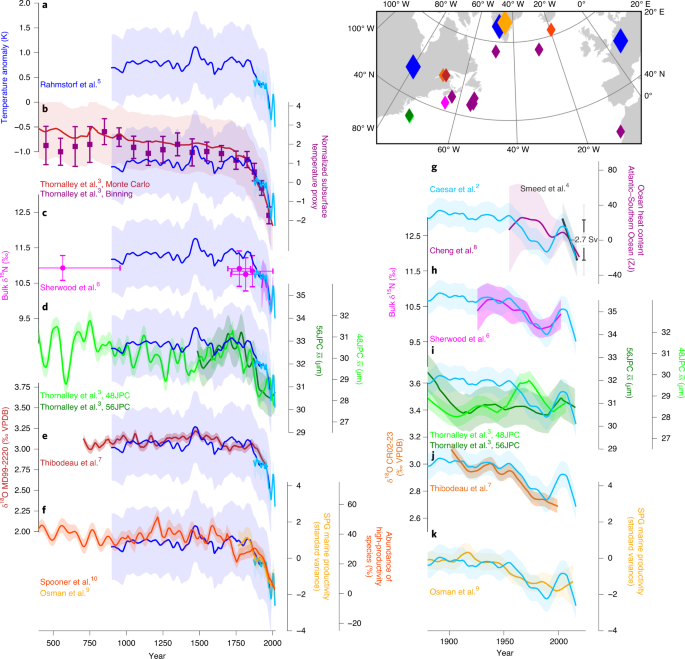
So you're saying after the recent 50 year increase in global heat ocean content, we will now see a decrease?
-
So do you believe the steady trend of an increase in global heat content in the oceans (as depicted in the graph above), will reverse its trend and decrease, or will this be a localized cooling trend while average of the planet's surface continues to warm?
-
Well I think that's the point. One warm or cold month gives little if any context for prevailing trends or "cycles", so using December to confirm the start of a long term cooling trend is a bit haphazard. And you say the following decades will be cooler (presumably cooler than this last decade). What do you anticipate will change that will cause that cooling? As posted above, the heat content in the oceans is steadily increasing, do you believe that trend will reverse in the coming years, and if so, why?
-
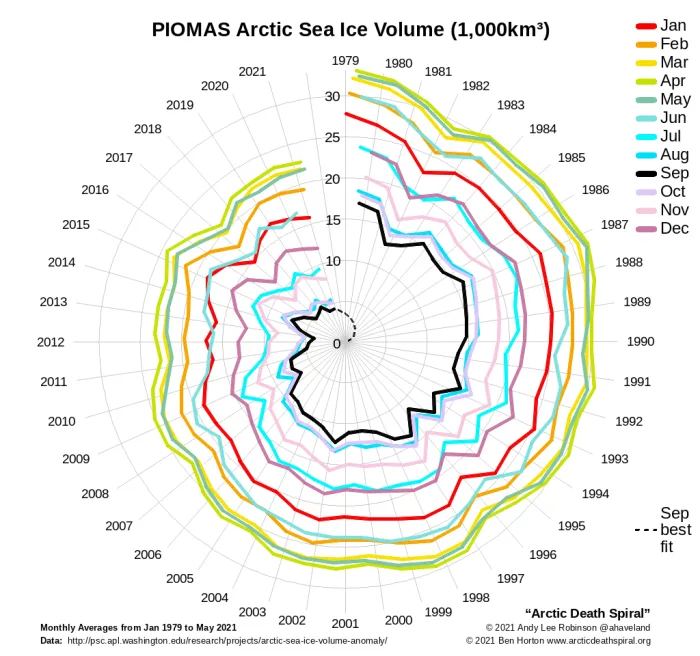
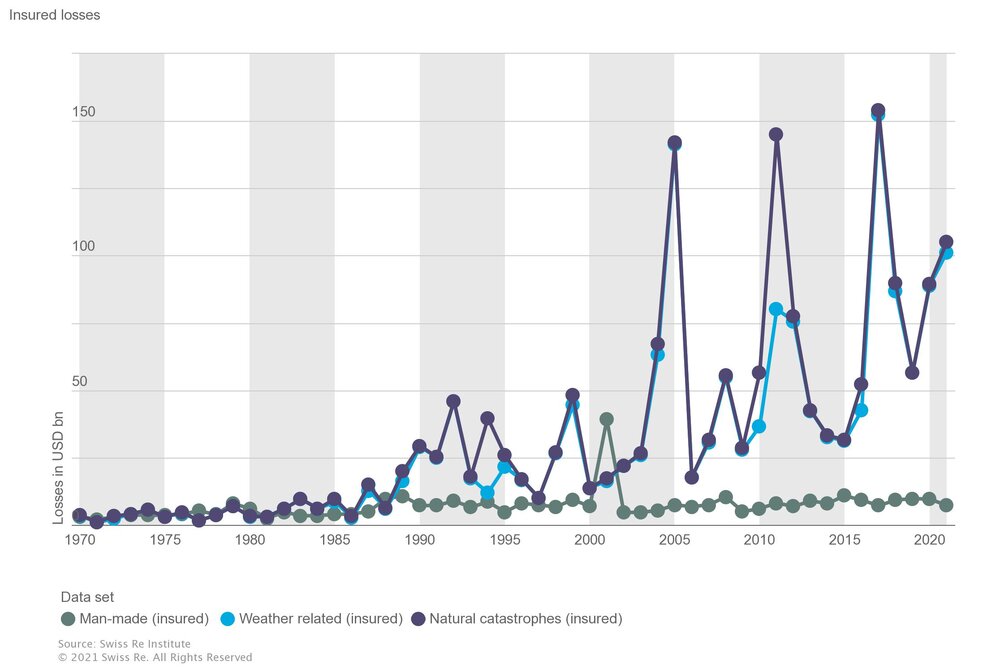
We are well on our way to a blue ocean event, as annual arctic sea ice steadily trends downwards. The AMOC is the weakest it's been in the last 1,000 years On the scale of economic damage due to climate change, insured losses due to extreme weather are on the rise. I believe this isn't adjusted for inflation, but even factoring that in shows a steady increase. Note the decoupling between man-made disasters and weather/natural catastrophes. On that note, a 2019 survey found that 72% of insurance firms believed that climate change would impact their business. Given how shortsighted the market is for understanding climate change risks, that is a telling statistic. For a more localized event, the 2021 PNW heatwave is said to have had a return period of about 1 in 1,000 years in today's climate, but it was reported that the event was made ~150x more common given human-induced climate change, and that in a world that is 2C above pre-industrial levels (0.8C more warming), that return period could be closer to 5-10 years. https://www.worldweatherattribution.org/wp-content/uploads/NW-US-extreme-heat-2021-scientific-report-WWA.pdf I understand that you used the word "attribute" specifically to question whether climate change has had a direct role in any given event, but you should know that's not how our climate system works. Instead, I posted the above examples to show how ~1-1.2C of AGW has nudged different indicators of our planet's climate in specific and predictable directions. Adding more energy to a system will do that. All 4 of the examples I've provided have literature behind them that suggests that climate change has contributed to the shifts that we've seen. Again, not direct attribution, but substantial contribution. A shifting of baselines you could say. I think they were poking fun at how you suggested that December was the start of a "cooling cycle of local climate", followed by a substantially AN month for your region and much of North America.
-
The “is it ever going to snow again” discussion.
Cobalt replied to psuhoffman's topic in Mid Atlantic
which is alarming when considering how much the Earth has warmed in just the last .0000022% of its lifespan. A blip on any natural timescales. It's been pretty overwhelmingly warm on the whole, with colder months being more of a rarity. Not just for the US, but for the entire northern hemisphere as a. Keep in mind how this is also using the 1991-2020 average. Using any previous baseline would cause this period to stand out even more. Our last horrific dud stretch of winters was much more localized with its warmth.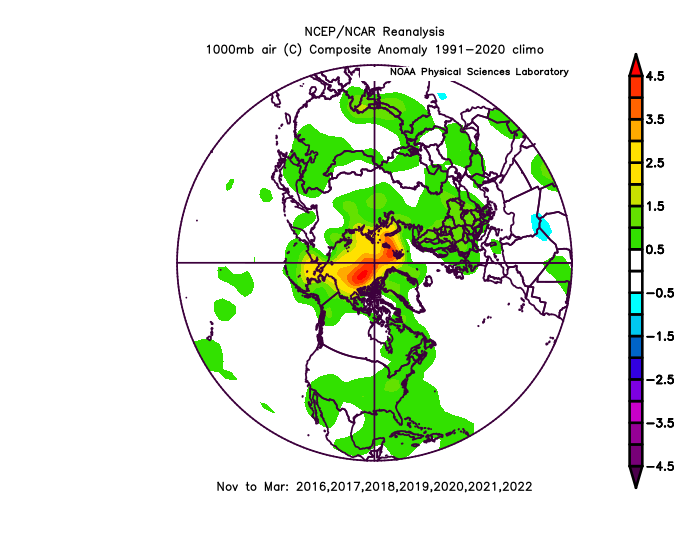
-
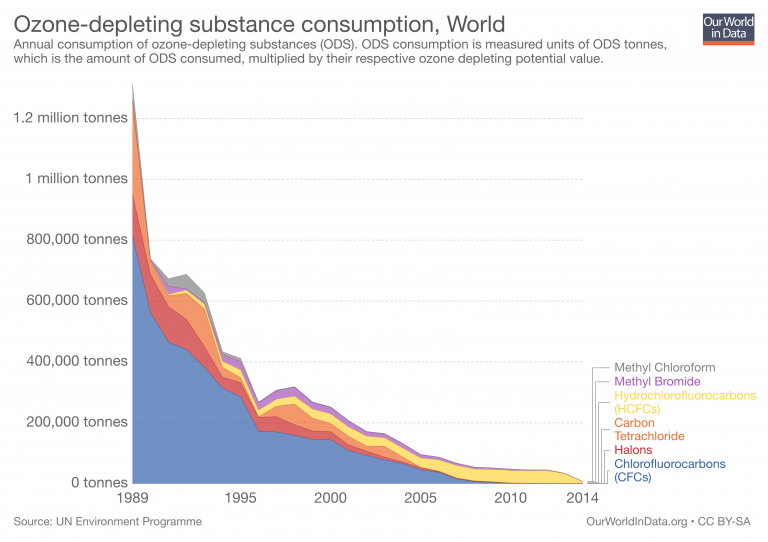
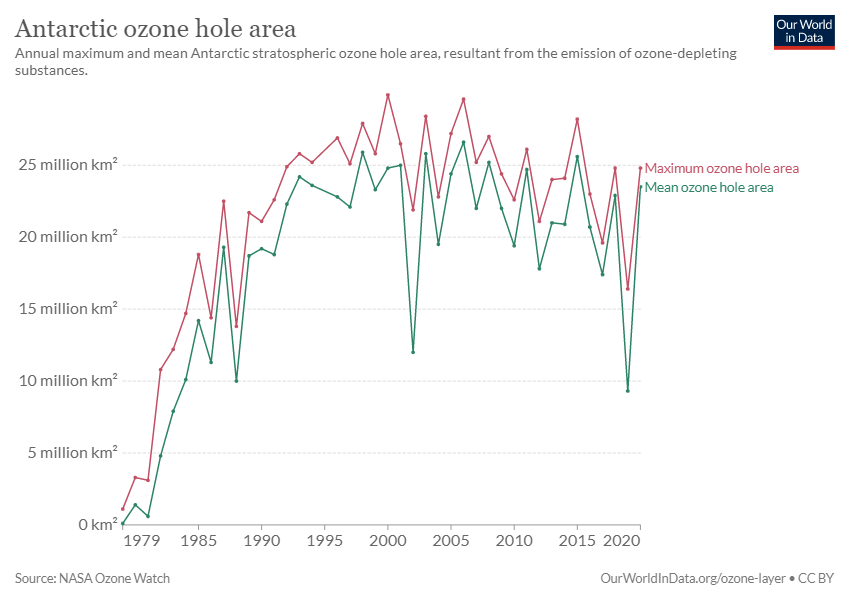
Thanks to the Montreal Protocol in 1987, international collaboration enabled the phasing out of several chemicals that contributed to depleting the ozone layer. And after phasing out these chemicals, the rate of increase in the ozone hole virtually diminished. Atmospheric ozone is set to return to 1980 levels by 2040-2060. All this to say that the "doom and gloom" science prediction didn't verify because international collaboration favored immediate changes to prevent a long-term issue. Something we unfortunately haven't been able to do for AGW as of yet.
-
Late February will be rocking. February Long range Discussion thread
Cobalt replied to Ji's topic in Mid Atlantic
Incredibly stationary distribution of temp anomalies. Despite all of the shuffling in h5, the look over time remains the same. How it started: How it's going ' Pessimism aside, even in some of our warmest recent Februaries (2017, 2018, 2022), a snow threat or two slipped into the scene, even if they were light events..thumb.png.3c7342a4f91d0f7be4a86ec4f0d4ab9f.png)

-
Jan 31 - Feb 1 Snow/Sleet/Misery Obs & Disco
Cobalt replied to NorthArlington101's topic in Mid Atlantic
About the best time to see a run like this take place.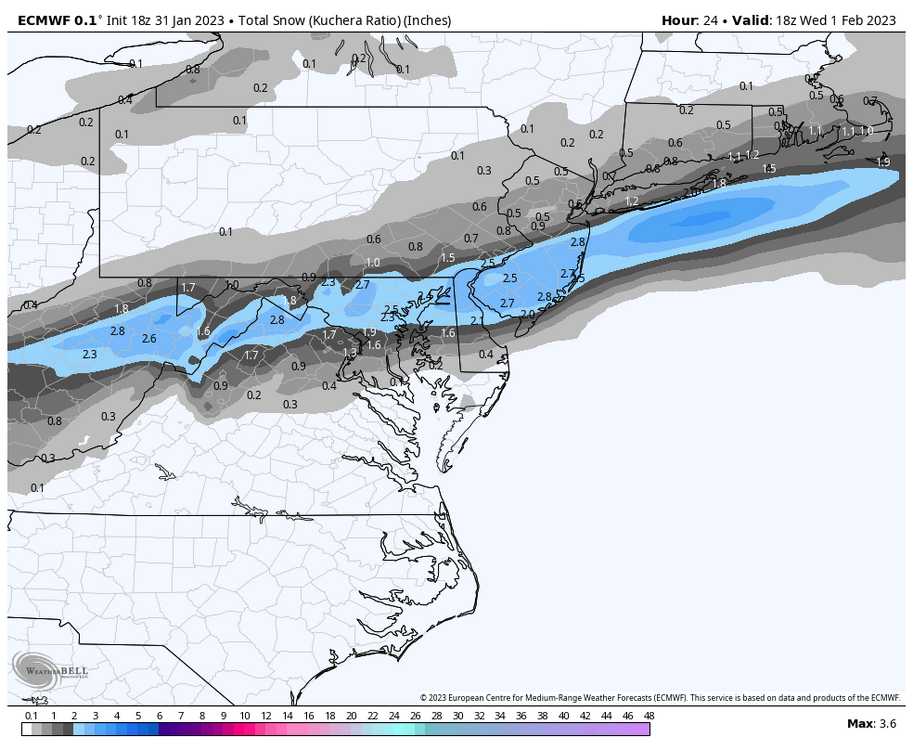
-
Late February will be rocking. February Long range Discussion thread
Cobalt replied to Ji's topic in Mid Atlantic
Revenge of the fifth (of March 2013) -
January/February Mid/Long Range Disco IV: A New Hope
Cobalt replied to stormtracker's topic in Mid Atlantic
Persistence, going with the warmer/less favorable look has been pretty reliable so far this entire winter. As for February itself, we've seen the -PNA/SE Ridge look persist in 5 of the 6 past instances (Feb 2021 being the only exception due to a stoutly negative AO/NAO), and so it's not far-fetched to think that the guidance might end up pretty spot on with it showing basically that exact warm Feb look. Remains to be seen. As for attempting to be more optimistic, even our warmest Februaries during that stretch (Feb 17, 18, and 20) had at least 1 or more snow threats for NC/VA, so maybe we can get lucky. It's just hard to count on. -
The “is it ever going to snow again” discussion.
Cobalt replied to psuhoffman's topic in Mid Atlantic
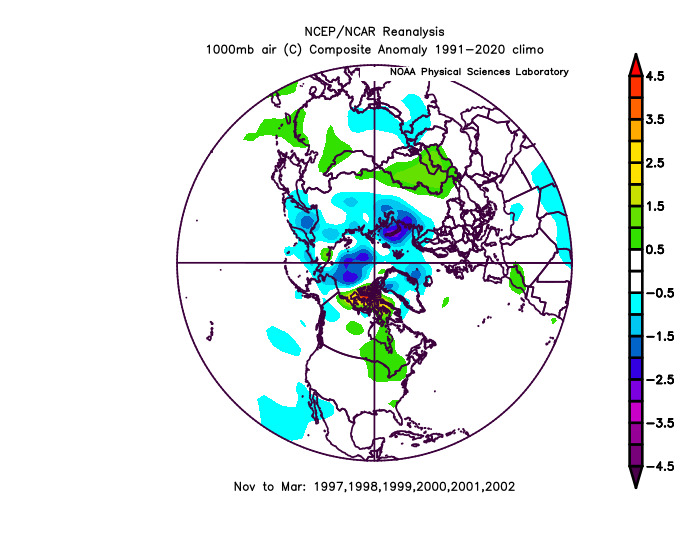
I spy a 2017, 2019, 2020, 2021, and 2022 on this list as well. All years from this recent stretch of futility, and all but one (2021) went on to have an AN February. If there was any wonder as to why we've been reliably snowless during this past 7 year stretch, reliable warmth is an easy culprit. -
January/February Mid/Long Range Disco IV: A New Hope
Cobalt replied to stormtracker's topic in Mid Atlantic
Just in time to ruin Spring -
January/February Mid/Long Range Disco IV: A New Hope
Cobalt replied to stormtracker's topic in Mid Atlantic
A solid increase of about 0-2 millimeters worth of precipitation for southern areas compared to the previous run
.thumb.png.c83ce170c5409ef944a7098529716c5f.png)
-
January/February Mid/Long Range Disco IV: A New Hope
Cobalt replied to stormtracker's topic in Mid Atlantic
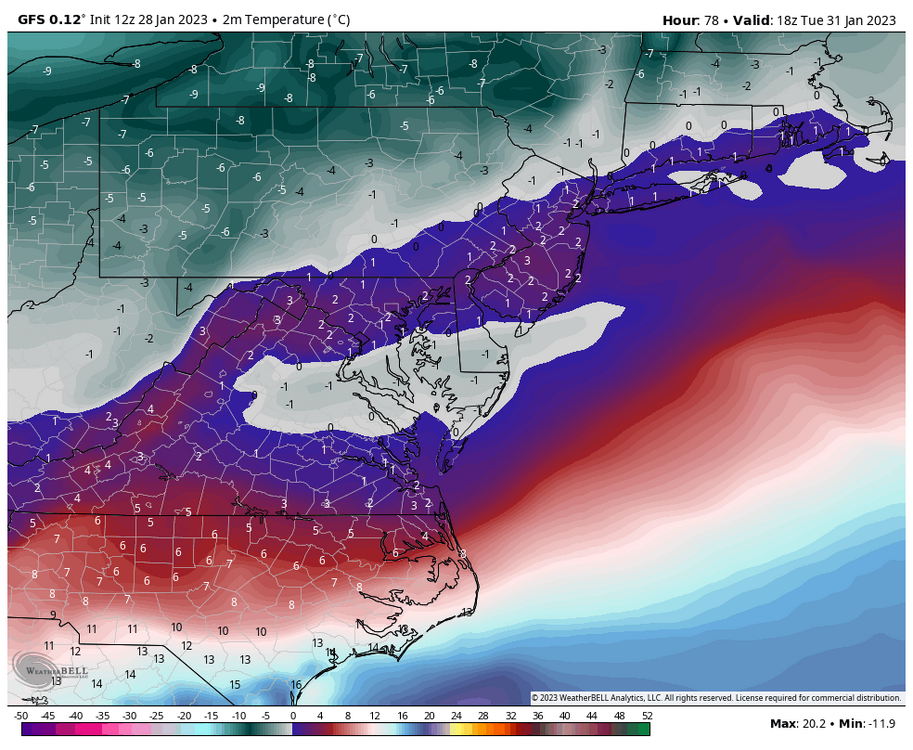
Curious as to if the GFS is keying in on the wrong wave entirely. It's been persistent in bringing a band of snow to the S part of our area near 18z Tuesday, meanwhile the rgem, ggem, and icon have been focusing more on 6z Wednesday. Interesting nonetheless edit: GFS did nudge North with the Wednesday precip, but by just a small margin. -
The “is it ever going to snow again” discussion.
Cobalt replied to psuhoffman's topic in Mid Atlantic
15-16 felt like a preview into what "good" winters of the future will look like. Perhaps a 1 month stretch of BN temperatures, even sharp but brief cold shots like with what happened during Presidents' Day Weekend, but in the aggregate, an AN temperature winter with AN snowfall, hoisted up by 1-2 major snowfalls and very few of our bread and butter marginal events. Even just looking back at our recent 7 year snow drought, our "snowier" winters of the bunch have really only been snowy months, a 30 day or so stretch that was just cold enough to support a few decent snowfalls. January 2022 and 2019 come to mind when thinking of that. -
January/February Mid/Long Range Disco IV: A New Hope
Cobalt replied to stormtracker's topic in Mid Atlantic
Just slightly off, might need a 1143mb high rather than an imperfect 1043 one. In all seriousness, that's a 2 run improvement in terms of presented precip, and the 18z GEFS did have a few extra hits in there, so curious as to whether that improves as well.
-
January/February Mid/Long Range Disco IV: A New Hope
Cobalt replied to stormtracker's topic in Mid Atlantic
So close, but at least it's good to know that surface and 850 thermals and would suggest an actual shot of snow out of this as per the GFS depiction. Would like to see models juice this wave up as we enter range, as they've hinted off and on.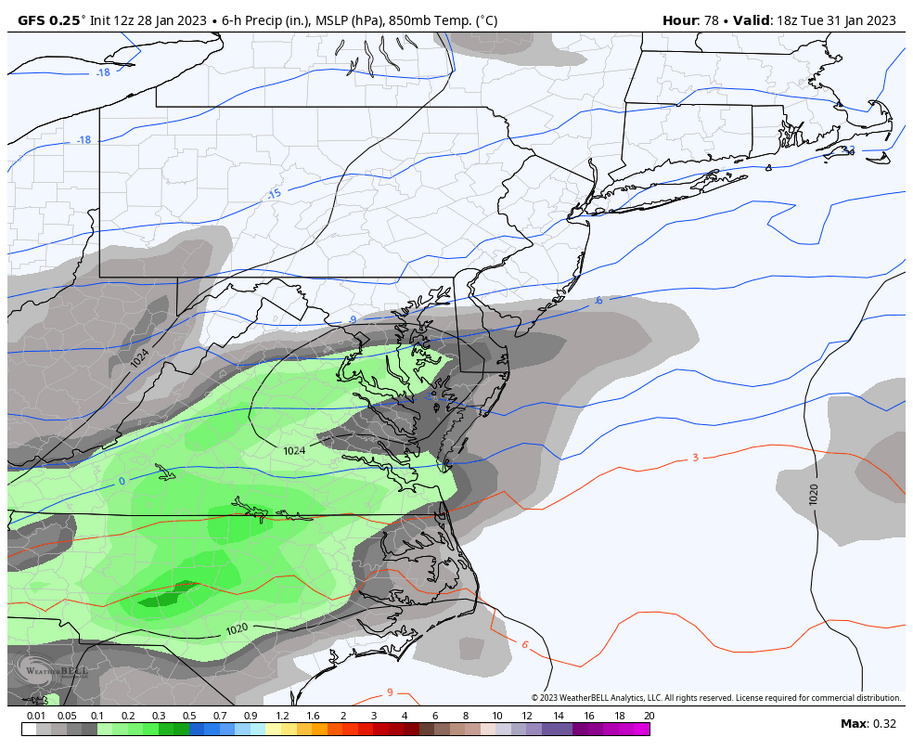


.png.bb3ccd9a96646a99a45bb7de7362822d.png)

.png.d031f984685e4f51e3f947dfc08251fe.png)