Newman
-
Posts
2,096 -
Joined
-
Last visited
Content Type
Profiles
Blogs
Forums
American Weather
Media Demo
Store
Gallery
Everything posted by Newman
-
KRDG and KABE both broke daily record highs today. 84 at Reading thus far and 82 at Allentown. Mount Pocono and Trenton also broke their daily records, PHL and KILG tied or close.
-
- 1,105 replies
-
- 3
-

-

-
- tropics
- heavy rainfall
- (and 5 more)
-
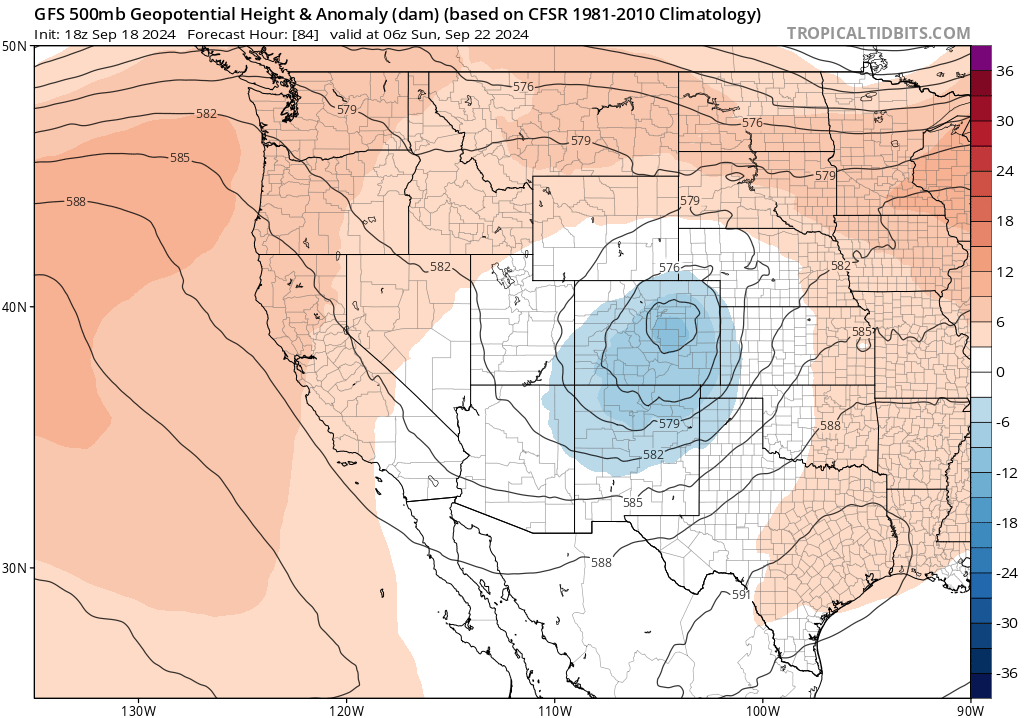
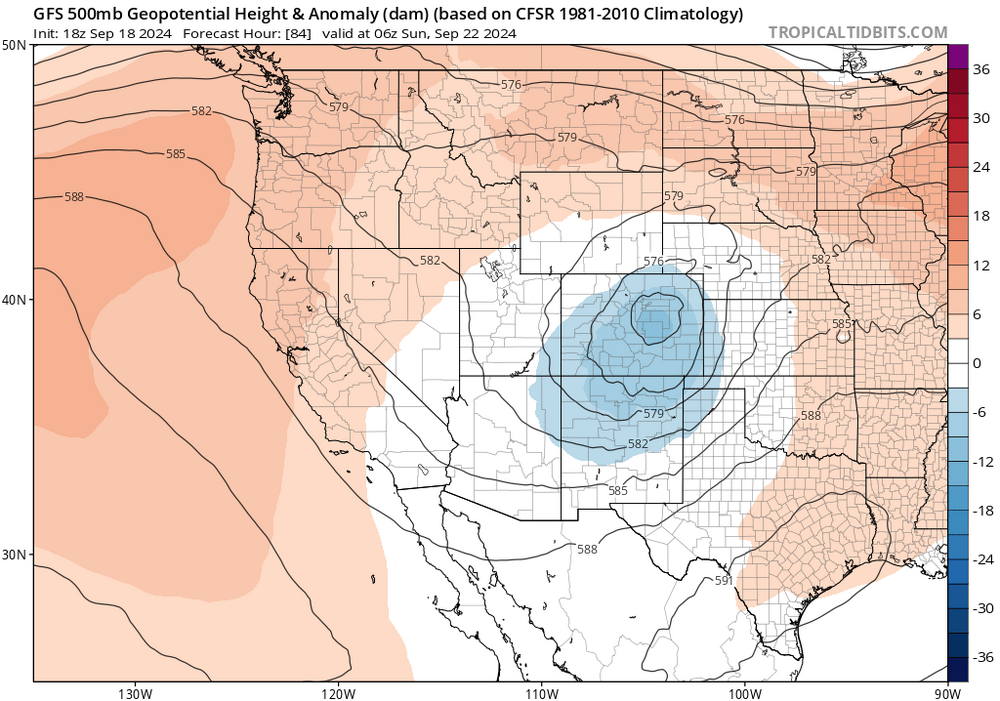
Watching what could be our first snowfall in the Laramie valley this week around Wednesday. Upper level trough digs into the West Coast and ejects across the front range/Rockies, spawning lee cyclogenesis. Question becomes how amplified this trough gets, with the Euro/Canadian advertising a deeper trough that allows positive vorticity advection in a favorable location south of Wyoming, and thus cyclogenesis across Colorado. Meanwhile the GFS is less aggressive and swings the energy through SE WY which would bring just rain and dry slotting.
-
KABE has only seen 0.01" of precip so far this month, for reference the record low for October precip at KABE is 0.15" back in 1963. Before this year, there have only been 4 years in the KABE record with October's less than 1" of precipitation. The Euro and GFS are consistent with showing a weak cold front moving through next weekend which may or may not break the current record. The Euro is most aggressive, the GFS weakens it for perhaps some sprinkles. Either way, I would be shocked if Allentown ends up with more than an inch of rain this month, or even a half inch for that matter. The KRDG records don't extend as far back as KABE, but the previous record at Reading is 0.71" in 2001. In Trenton, also 2001 with 0.51". At KPHL, 1963 is also the record like Allentown when only 0.09" of precip fell in October. All of these locations have 0.02" or less of precip this month.
-
Was checking KRDG climate data this morning and, going back two months to August 13th, only 1.37" of precip has been recorded there which is close to the 1886 record of 1.17". For reference, the average during this stretch is 9.3". Euro and GFS ensembles are pretty adamant on a cold/dry and warm/dry pattern setting up, with any cool spells bringing in a dry NW flow, and then a subsequent upper level ridge setting up shop. Not really anything exciting to point out looking ahead.
- 1,105 replies
-
- 2
-
-
- tropics
- heavy rainfall
- (and 5 more)
-
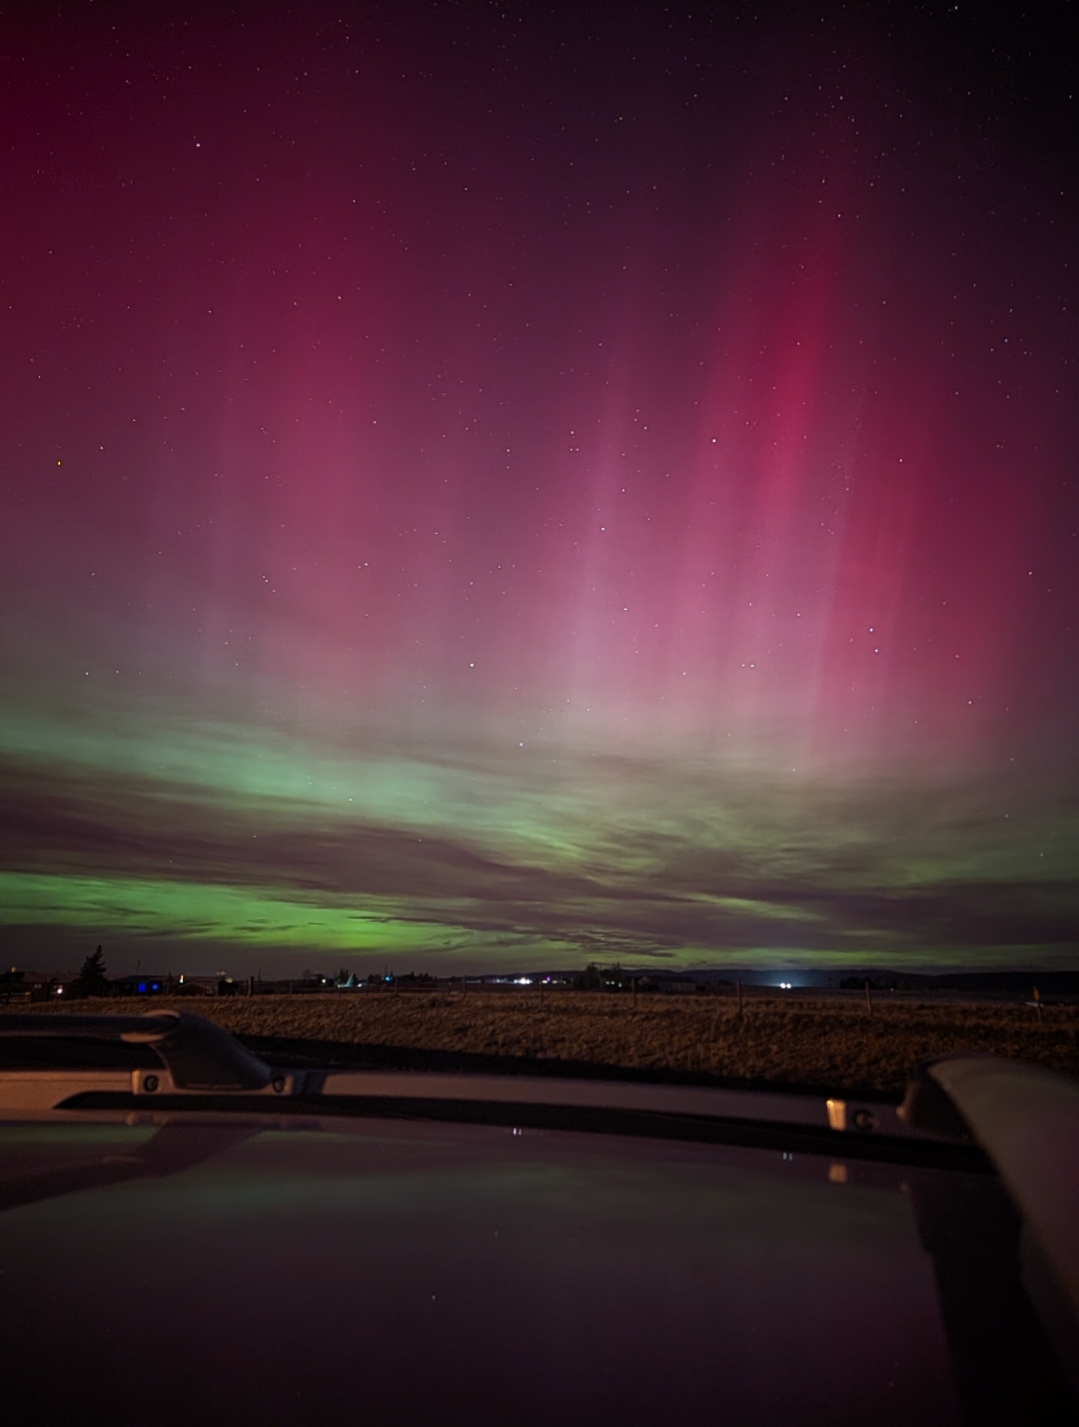
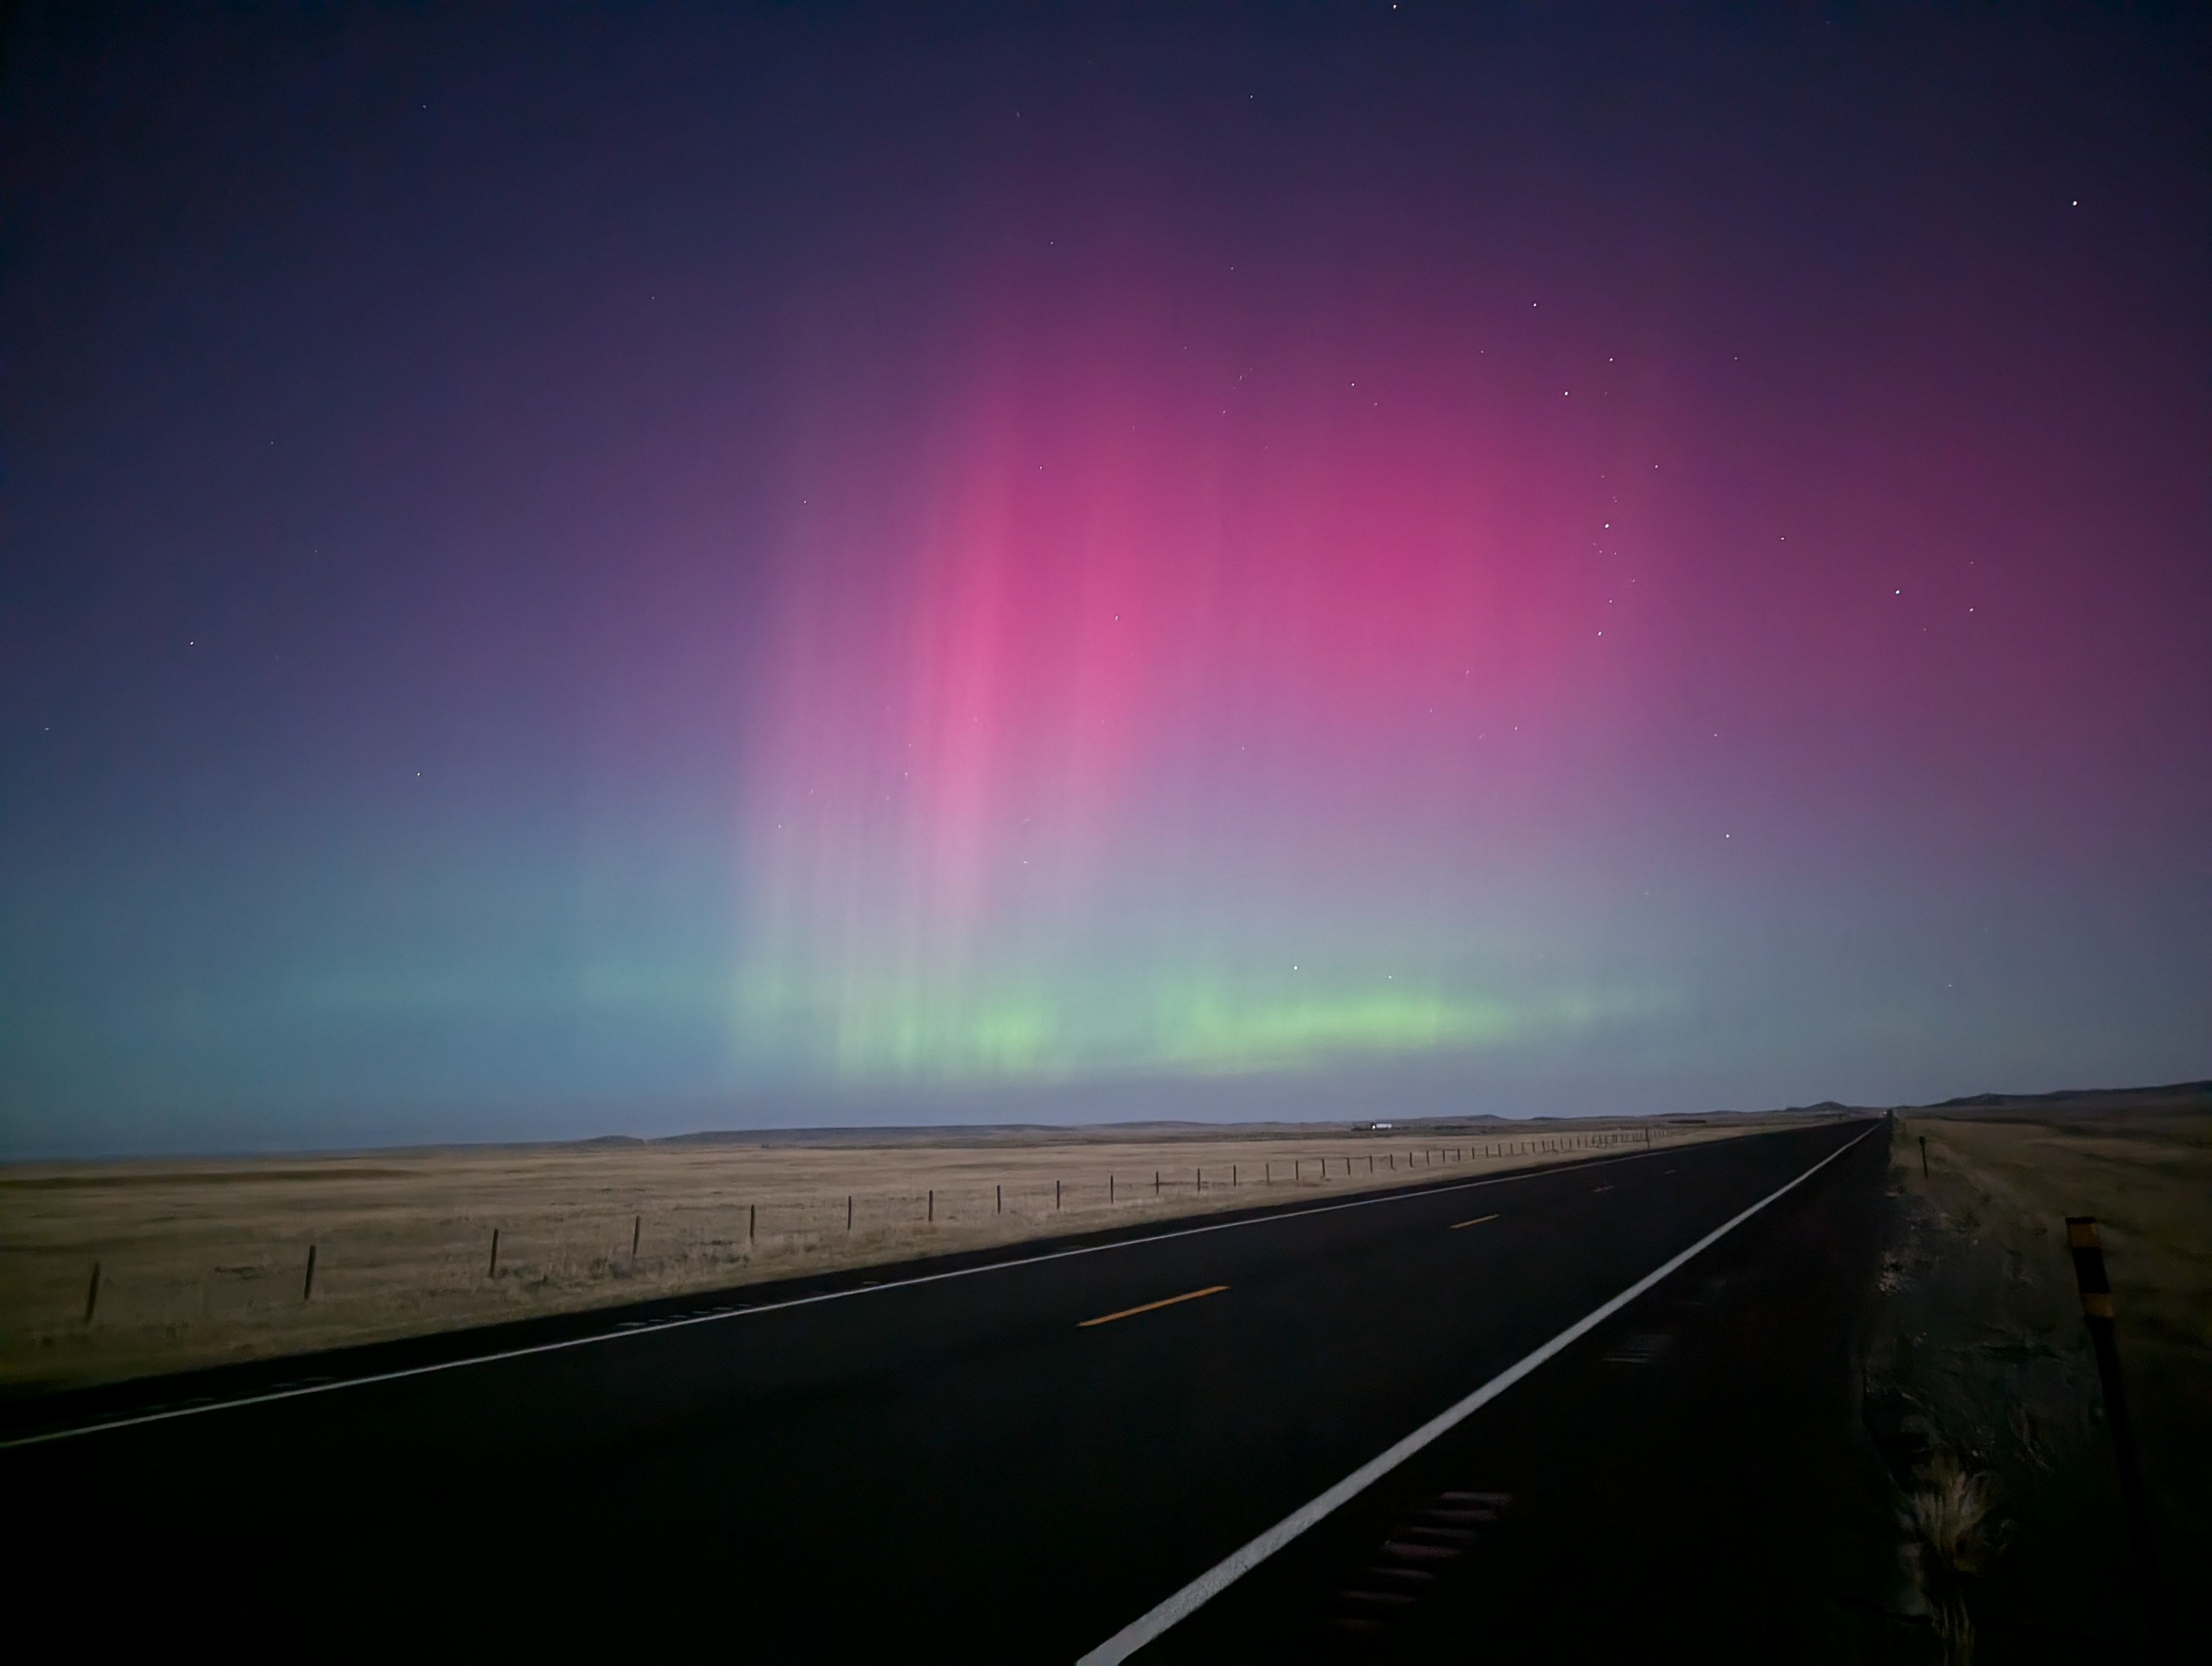
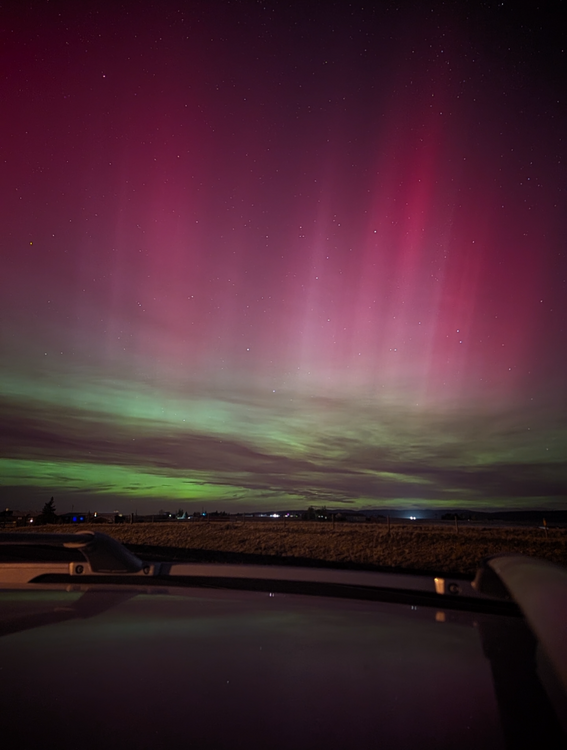
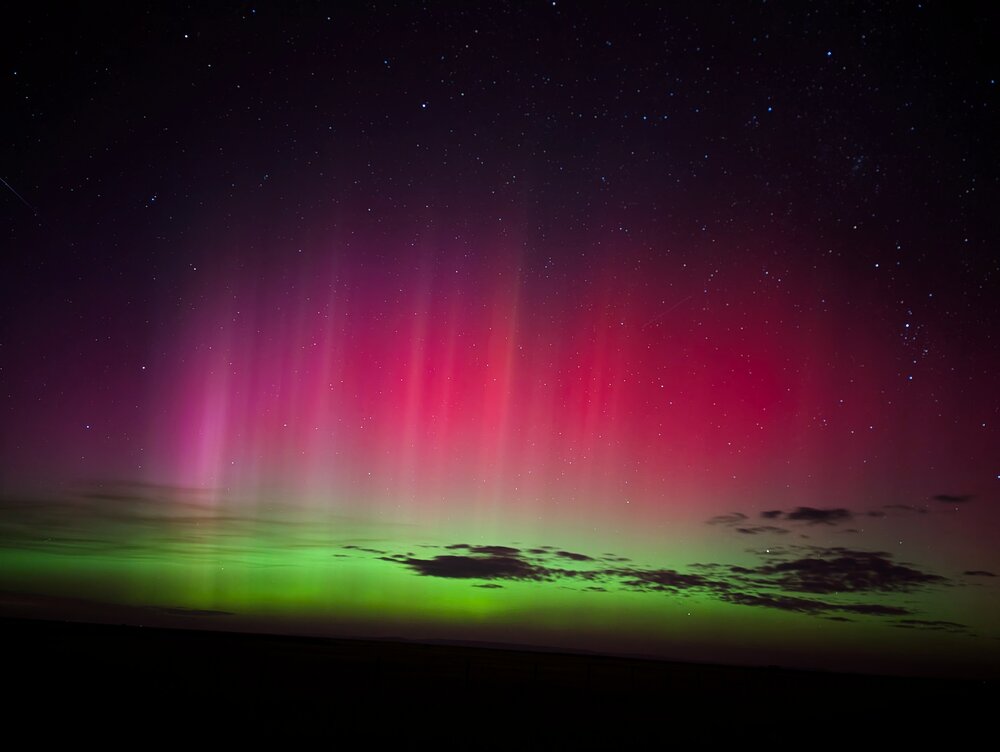
Figured I'd drop some of the aurora pics I got tonight out here. Maybe not the brightest Aurora I've ever seen, but definitely the highest in the sky. The pillars stretched above zenith at times

- 1,105 replies
-
- 6
-
-
- tropics
- heavy rainfall
- (and 5 more)
-
From my experience, on a more "normal" night of geomagnetic activity the "recharge" usually lasts 2-2.5 hours and then the spike back up is a quick 5-10 minute burst. Tonight isn't normal, we're talking very variable and chaotic conditions with the magnetic field strength. So from experience, I would say maybe around 10:30-11 there *could* be the next substorm. But it all changes in real time. I took this time lapse here earlier this week, which happened right during a substorm. Otherwise, the colors were mostly muted before and after this. PXL_20241008_022847432.NIGHT.mp4
- 1,105 replies
-
- 3
-
-
- tropics
- heavy rainfall
- (and 5 more)
-
Space Weather geek here: that huge burst of aurora was due to an auroral "substorm" that often occurs, we will likely see more through the night. You can track here at the GOES magnetometer site the strength of the parallel component of the Earth's magnetic field. I will explain why that's important below this... https://www.swpc.noaa.gov/products/goes-magnetometer Basically, what happens is the Earth's magnetosphere (more specifically it's magnetotail) gets stretched and then subsequently rubber bands back and releases the built up energy. When it rubber bands back, that produces the bursts of Aurora. They usually occur every 2-3 hours. On that website, you can time the substorms by looking at the large down spikes, that indicates the aurora is "charging up". Then when it spikes back up, that means it releases the energy in a beautiful aurora display. I would recommend changing the tab to 6 hours to get a close up view of what the magnetometer is measuring. All of this to say... You might have to wait another 2 hours or so for the bright views to come back! They come in waves and that's just the nature of these things. But it's cool, you can actually predict Aurora substorms and bright views.
- 1,105 replies
-
- 4
-

-
-
- tropics
- heavy rainfall
- (and 5 more)
-
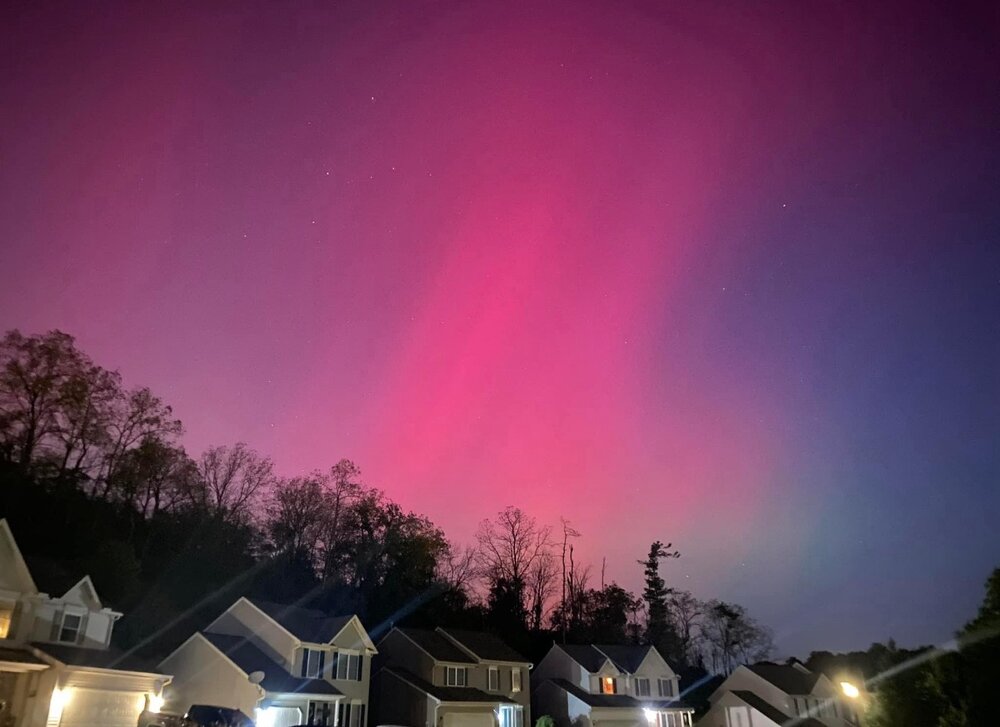
Sister in Reading just took this! Get out you guys!
- 1,105 replies
-
- 2
-
-
- tropics
- heavy rainfall
- (and 5 more)
-
Overhead Aurora in CT https://x.com/Vincent_Ledvina/status/1844517855452332258
-
Tropicana Field aftermath https://twitter.com/Ry_Bass/status/1844367980249178396
-
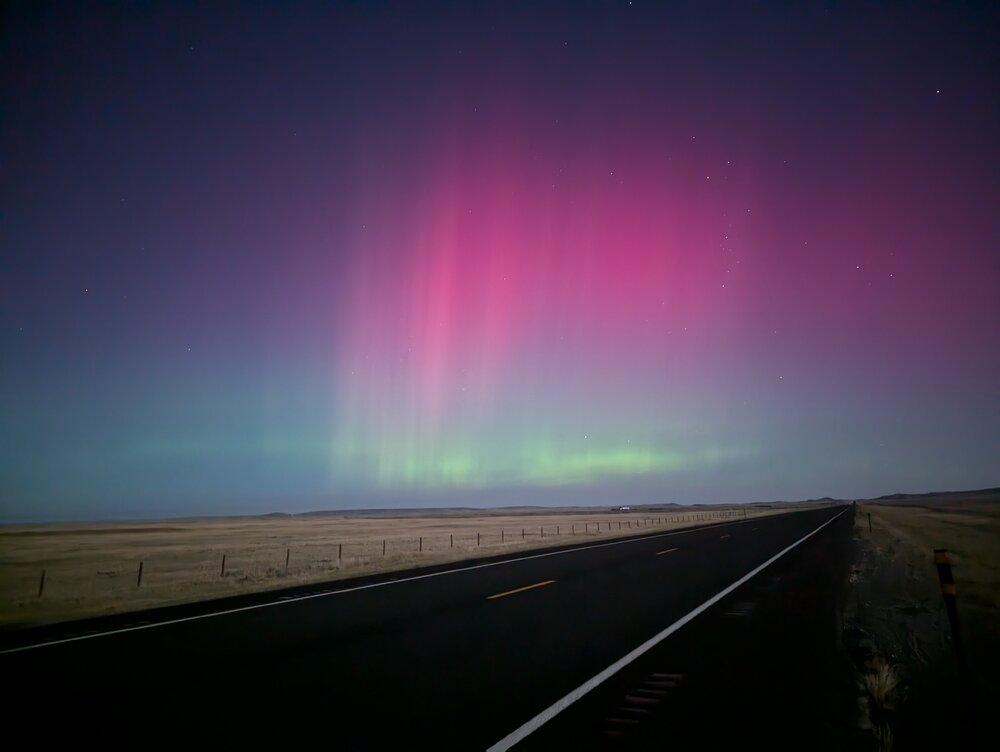
Even more incredible Aurora up here tonight. No edits at all, captured on my Google Pixel cell phone with 4 minute exposure time. 8:28pm north of Laramie
-
..CENTRAL PRESSURE IN THE EYE OF MILTON HAS FALLEN TO A NEAR RECORD LOW... ...MILTON POSES AN EXTREMELY SERIOUS THREAT TO FLORIDA AND RESIDENTS ARE URGED TO FOLLOW THE ORDERS OF LOCAL OFFICIALS... 7:00 PM CDT Mon Oct 7 Location: 21.9°N 90.4°W Moving: E at 10 mph Min pressure: 897 mb Max sustained: 180 mph
-
We still haven't hit 32 at the Laramie AP this fall, which has broken our record for the latest first freeze on record (previous record October 4th).
-
Advisories will be issued starting at 10am CDT on soon to be Milton
-
...HELENE NOW AN EXTREMELY DANGEROUS CATEGORY 4 HURRICANE... 6:20 PM EDT Thu Sep 26 Location: 28.0°N 84.5°W Moving: NNE at 23 mph Min pressure: 947 mb Max sustained: 130 mph
-
That closed off shortwave sliding underneath/through the region should be enough to give some solid snows to the higher elevations
-
Saw some good Aurora up here in Wyoming last night
-
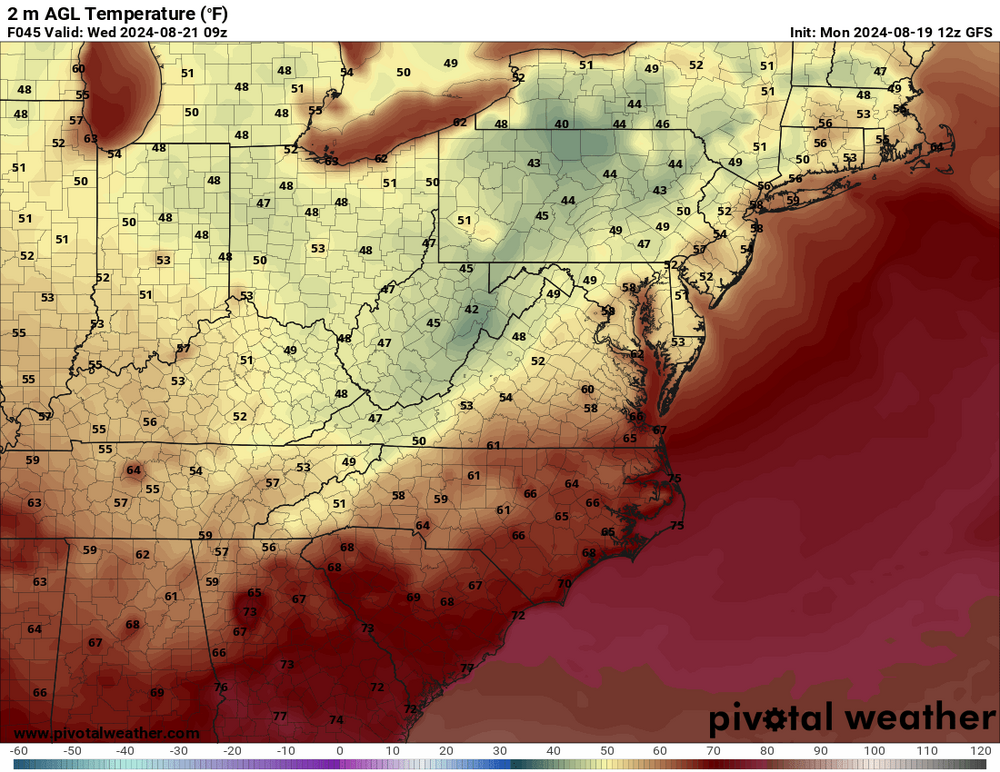
A cutoff trough will dip down into the region early this week. Low temps Tuesday/Wednesday night in Harrisburg are forecasted to reach around 53° by the NWS, though some models including the GFS dip the LSV into the upper 40s with clear skies. As a note, Harrisburg proper hasn't dipped as low as 53° in August since 2013. And it also hasn't gotten into the 40s in August since 1987. Williamsport is forecasted to reach the upper 40s, which last happened in August in 2013 as well.
-
The atmosphere is basically cooked now with these training storms and BL overturning. So that will be running into a stable environment. It's got some strong effective bulk shear and helicity to work with, which may help with some organization, but I don't think that'll be able to overcome the stability. Lots more rain from it though across the LSV. Maybe some gusty 50mph winds with any outflow. With the ridge in the Atlantic and trough in the north central plains trending Debby to stay further west once it makes it's second landfall, I could see the CPA (along with CNY) taking the brunt of the rain. WPC has been shifting things slowly further west as well. This rain today certainly will not help with flooding concerns.
-
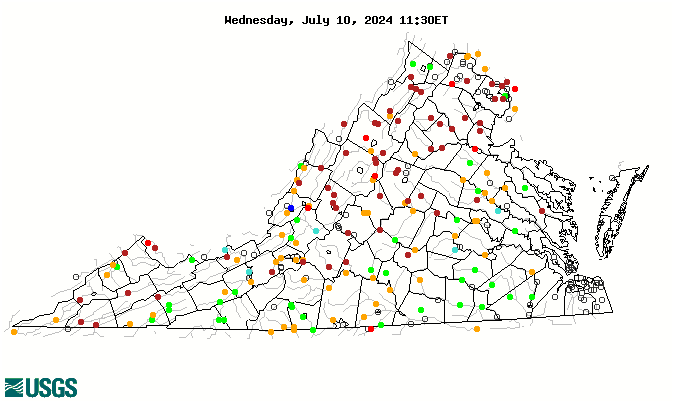
I wouldn't want to be an AT thru hiker in Virginia right now, I bet water sources are scarce
-
Solid storm with a tornado warning heading right up into Wellsboro
-
Those cells up in NW Clinton County are starting to get some good hooks on them
-
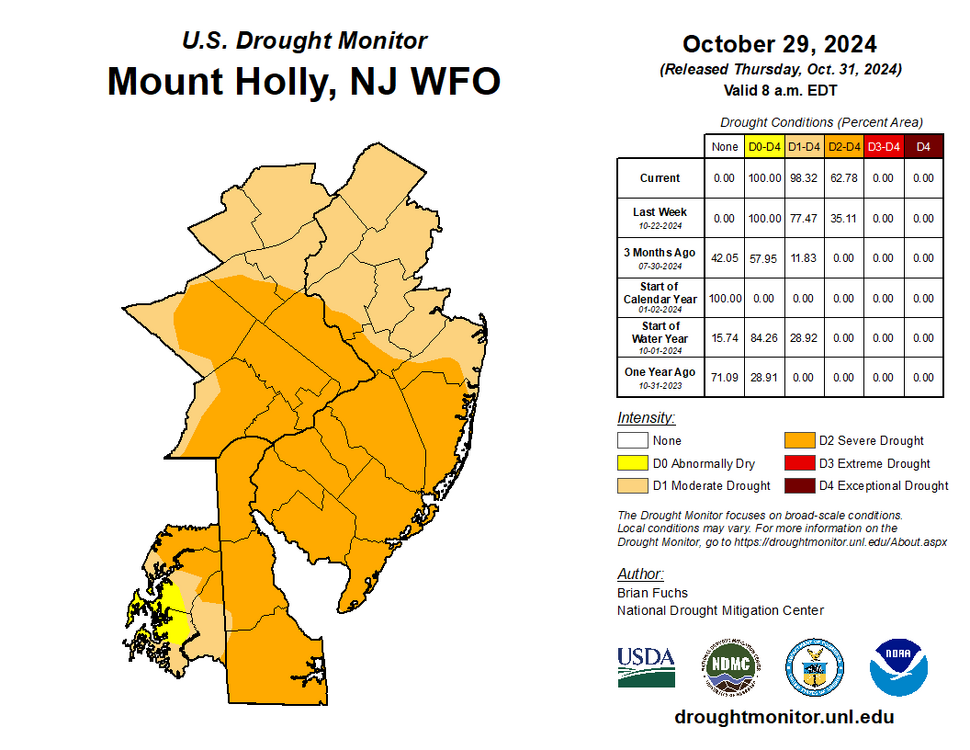
Was actually just talking to my buddy in Leesburg and were discussing the low water levels across much of northern VA. Dark red dots indicate <10% percentile of river/stream/creek gauge levels. Bright red indicate record lows for this date