MAG5035
-
Posts
5,882 -
Joined
-
Last visited
Content Type
Profiles
Blogs
Forums
American Weather
Media Demo
Store
Gallery
Everything posted by MAG5035
-
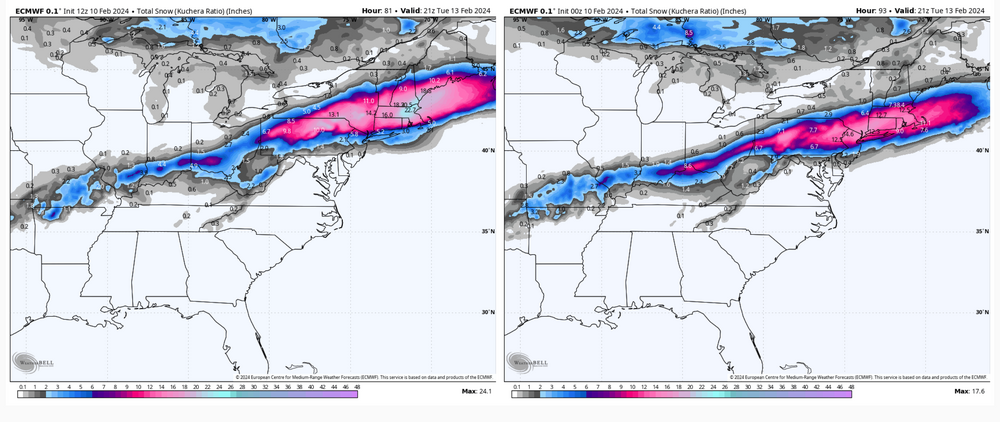
Euro has bumped it’s swath north the last couple runs, matching more of a GFS type swath. The difference being the Sus Valley when comparing GFS v Euro accums.. and GFS is def not my go to if I have to use a global to determine snowfall in the Sus Valley. Euro is probably a better representation of what’s going to happen snow wise with its solution at 12z. 12z vs 0z runs Stronger primary that pushes just a bit further north and keeps things aloft just a bit warmer. I’ve said or at least implied we don’t want to get this to being a longer period of rain to snow changeover event in the southern tier. It’s not the path to success for the Sus Valley with this (or even over here for that matter). Just commenting on the solutions at face value here. There’s not much of a consensus to be had for this cycle op wise. Cold NAM with forum wide snow, GFS/EURO with heaviest swath I-80 and north, UKMET with a southern slider that snows I-80 and south, Canadian with NOTHING, and der IKON so far north that plowable snow is NY border counties and north.
-
Nah you guys are looking pretty good right now, and I don’t anticipate p-type issues up that far. All guidance/ensembles not named the ICON (furthest north outlier by far currently) has Williamsport near or within the swath of best snows. Euro and GFS ops have had IPT getting 6”+ and GFS has been putting out double digits there the last several runs.
-
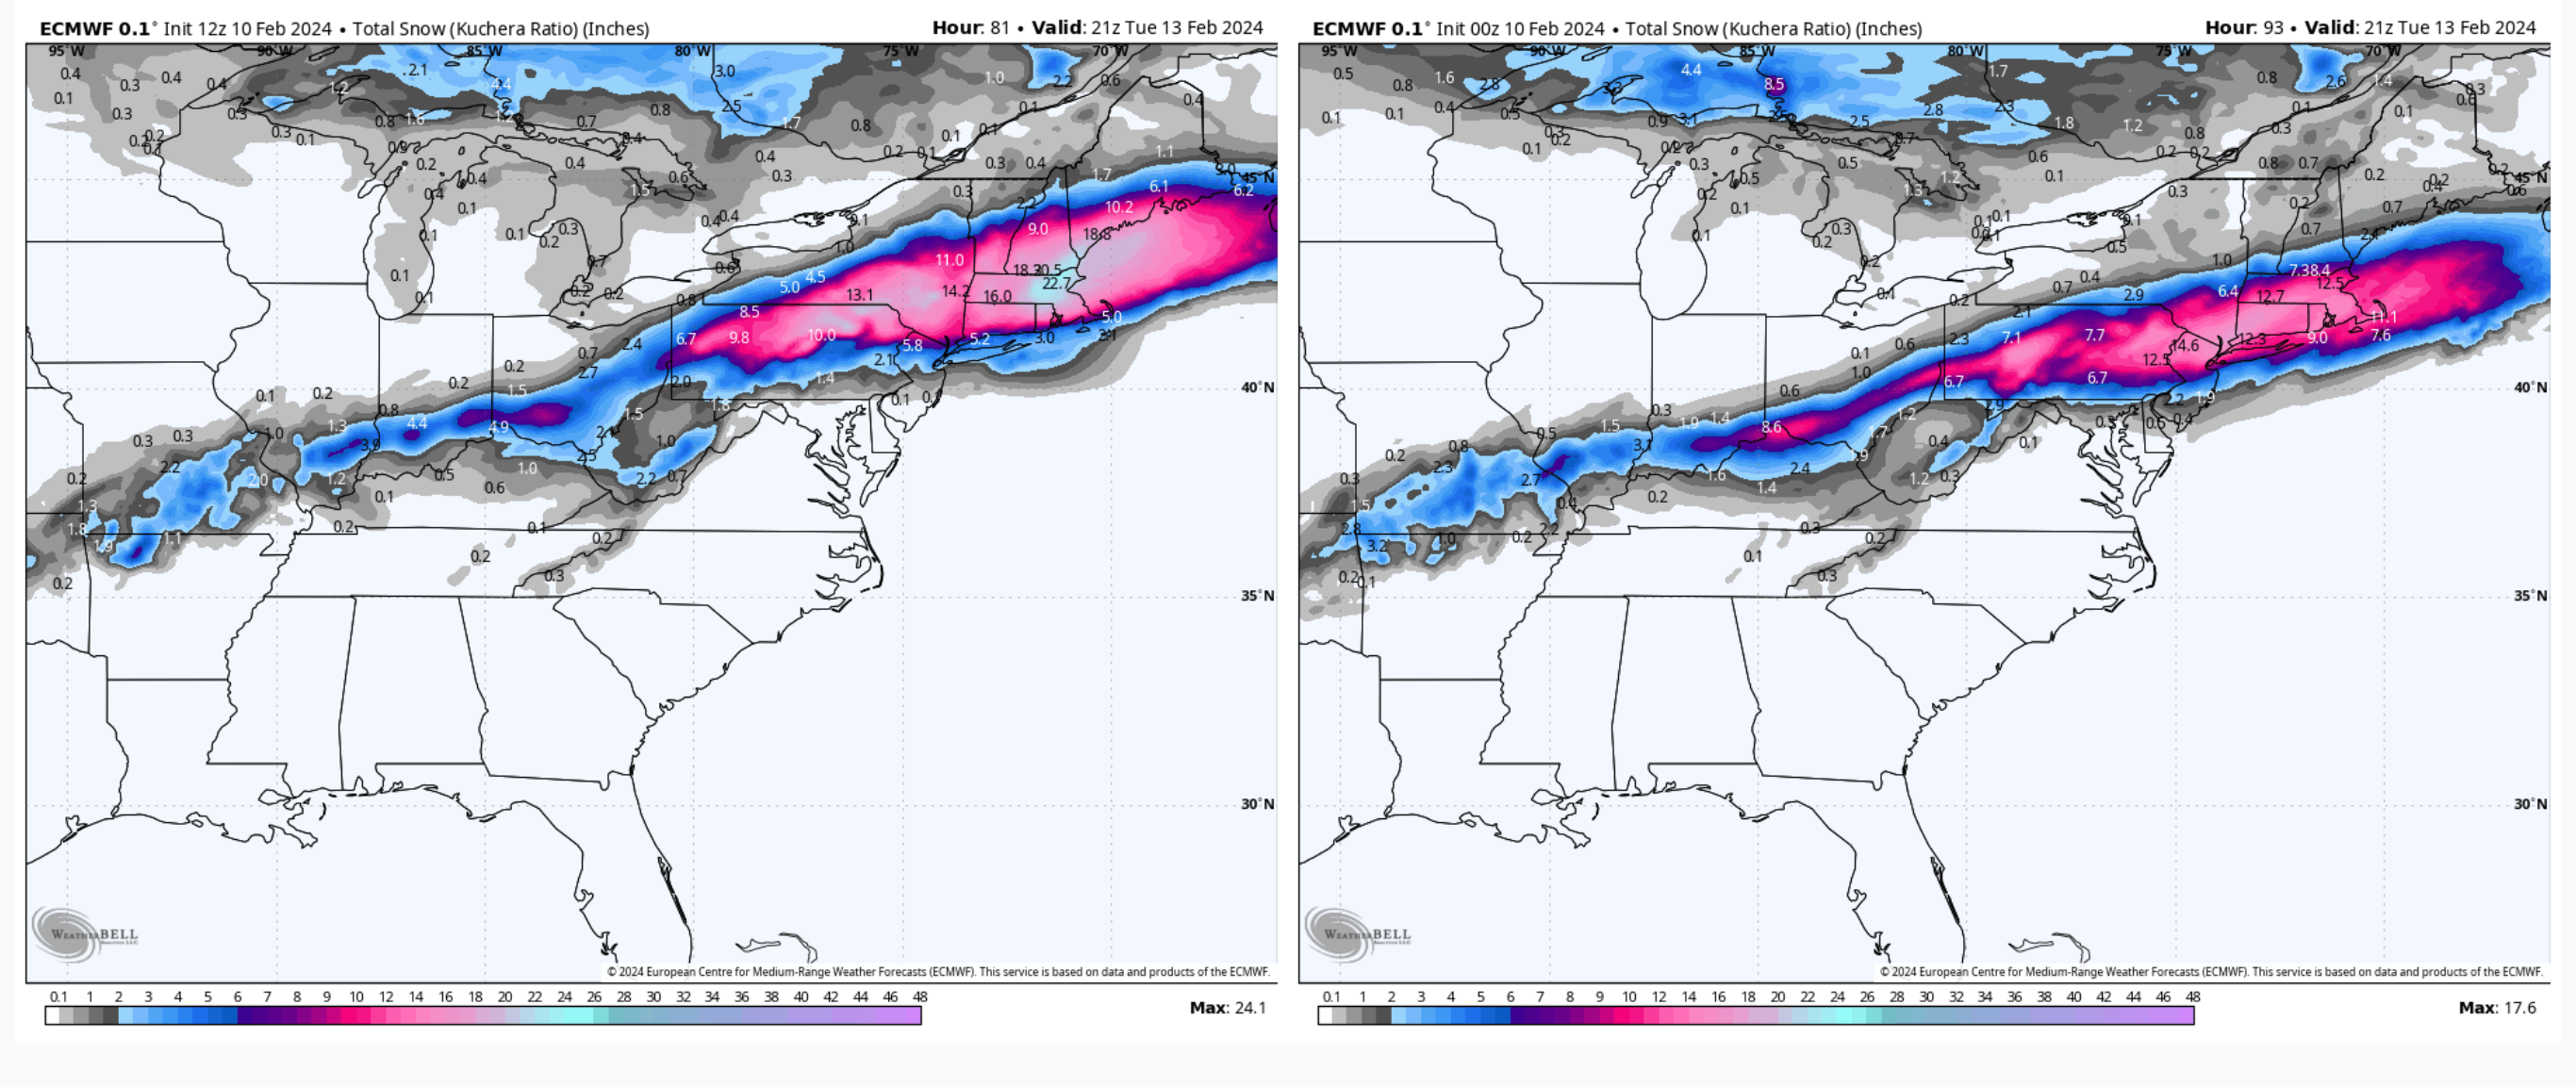
0z GFS coming in similar to 18z (and 12z). It may have shifted its 6” line like 10-20miles north in the Sus Valley from 18z, essentially back about to where it was at 12z. Focus on I-80 corridor on north for the axis of heaviest snows has been persistent with that op 0z Canadian looks nice with snow shield placement on the southern 2/3 of PA. Still on the lower side QPF wise and a bit splotchy with its output on accums but it has come a pretty long way from where it was having a very weak system. I started this post to comment on the NAM, but ended up commenting on the rest of early 0z guidance in the process. At any rate, NAM at range disclaimers aside… I have noted in the runs today that it seems to be on the colder side of guidance overall. Probably the coldest to be honest. I generally put heavier focus on the high res stuff for thermals (3k NAM, HRRR, etc) when things get in range to start using them. We start setting the boundary during Sunday, basically in the 48-60hr range at this point. So this is going to be really something to watch as we set this event up. The entire NAM column in PA is colder, but where it is especially so is up on the column at the 850 and 925mb level. 850 mb temp difference between NAM vs GFS is huge. 81 hours, where the event is pretty well underway in C-PA (GFS timing a bit faster) Now look at the 850 temps for that frame. Is the NAM onto something here? I’ll be curious to see if it holds onto anywhere near that cold of a profile as we get closer into range. Just a few degrees is going to make a big difference in this event, especially in the Sus Valley. Even a compromise of the thermal profiles between these two solutions likely get the subforum a decent event… and the GFS solution is still mostly a C-PA snow event anyways with the question mark of changeover delivering decent snows being the southern tier (turnpike corridor and south). The NAM at face value actually implies something that could be a notably >10:1 ratio event with the -8ºC 850mb isotherm deep into central/southern PA. I still feel in PA the heavy swath is a 6-10” type deal, but a NAM solution would be how double digit totals get introduced.

-
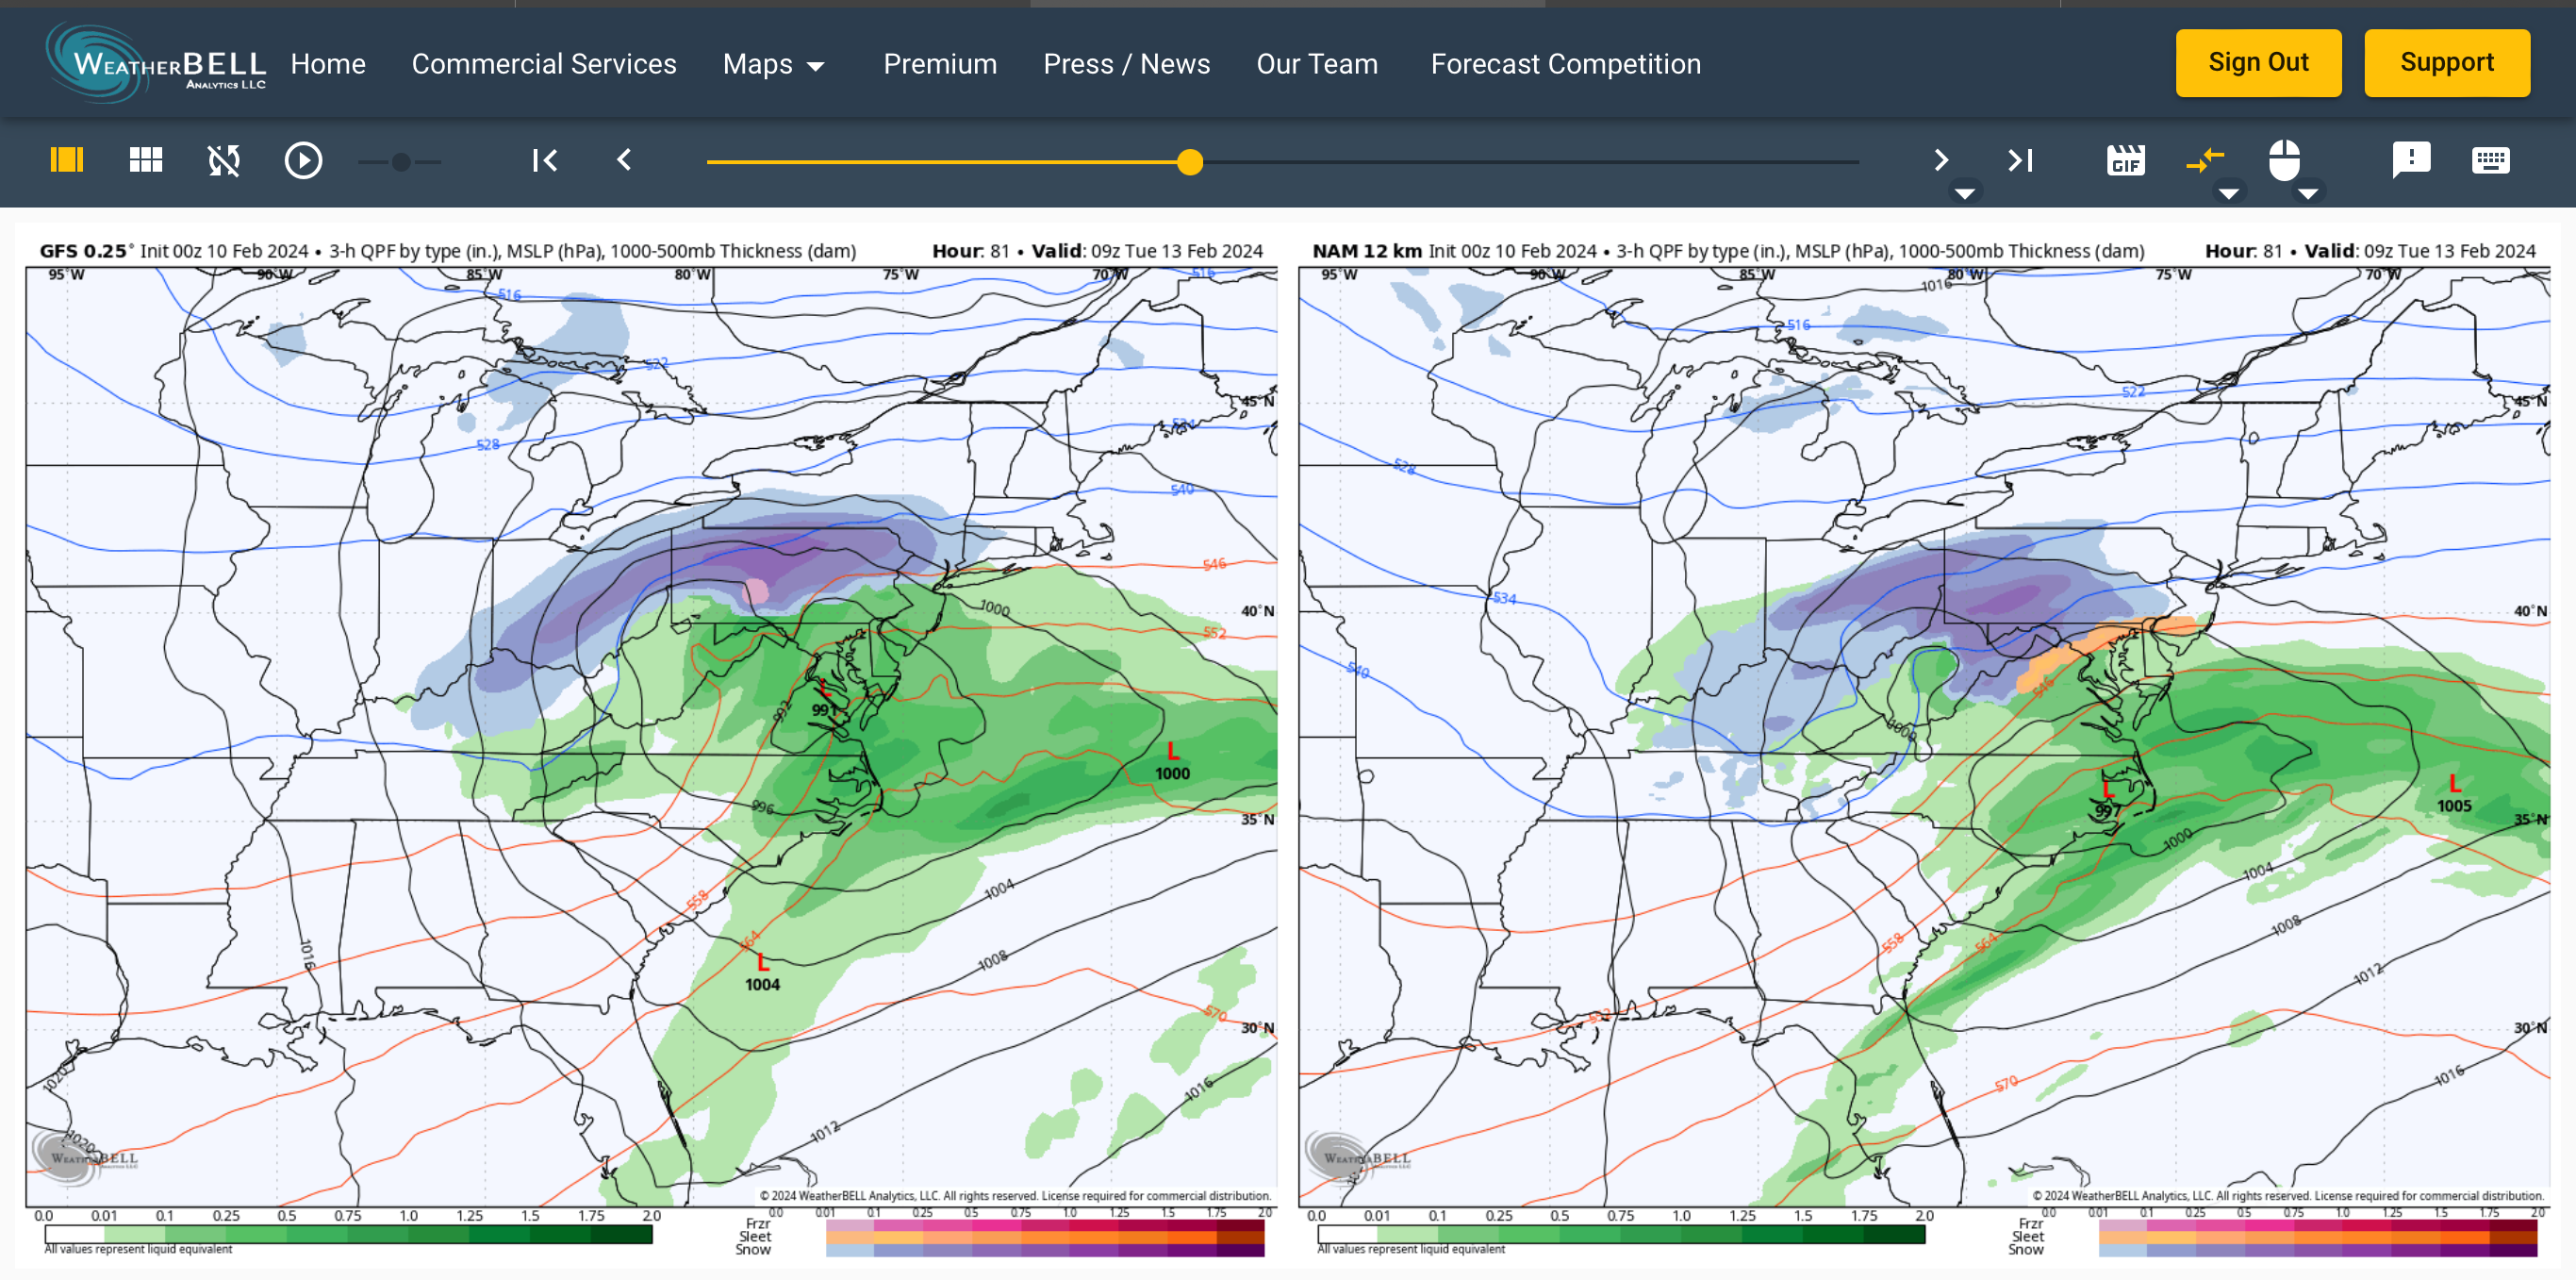
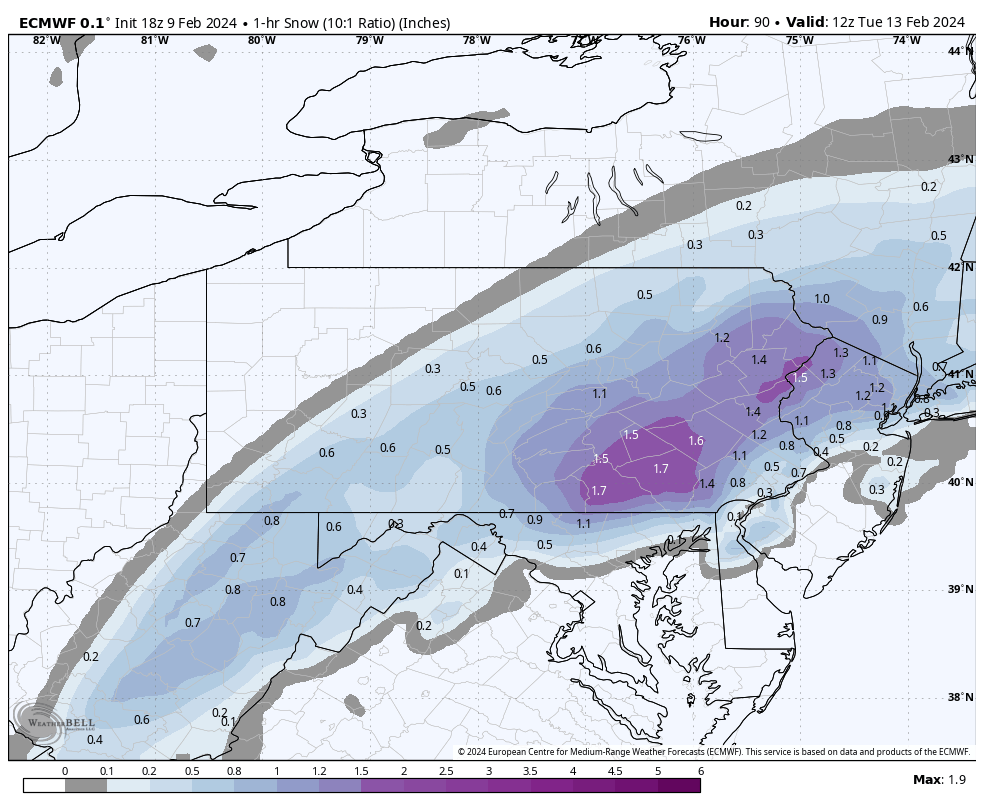
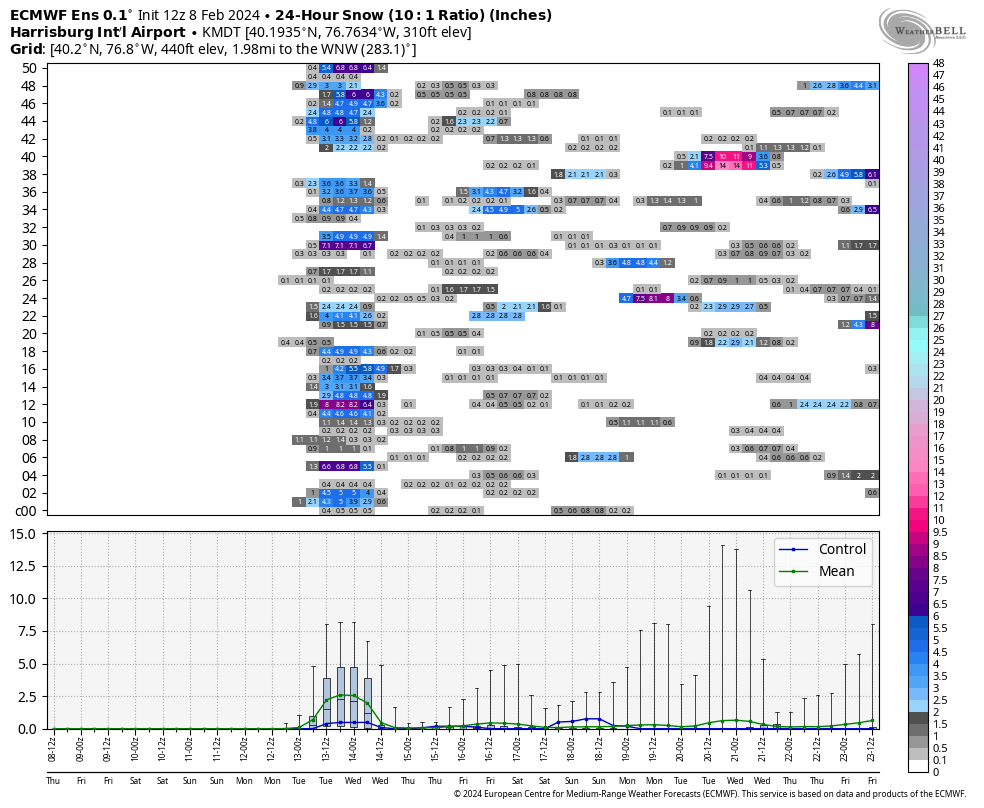
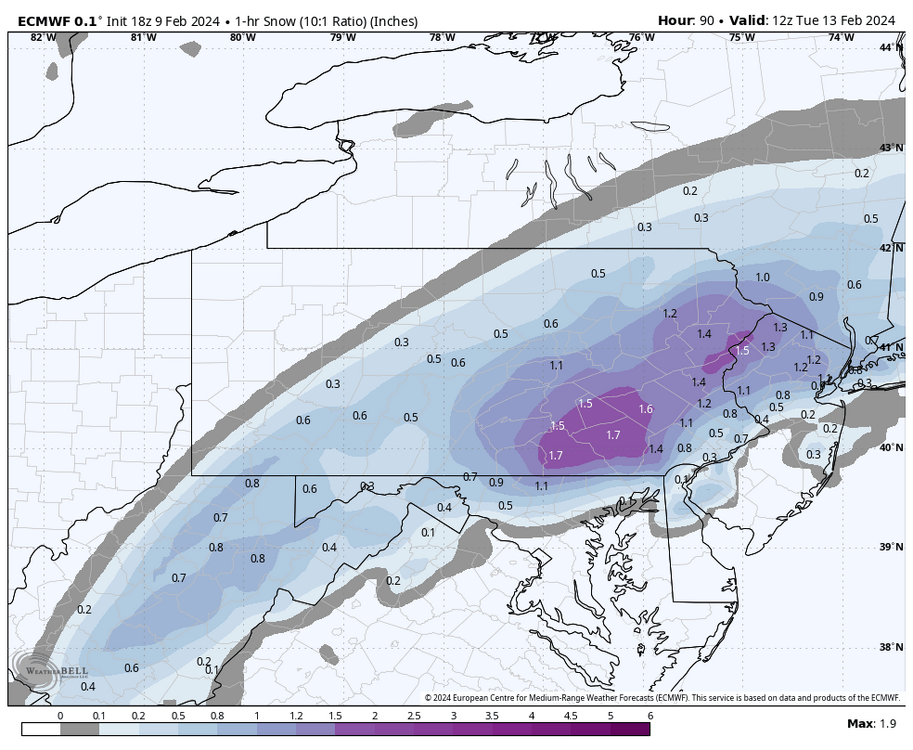
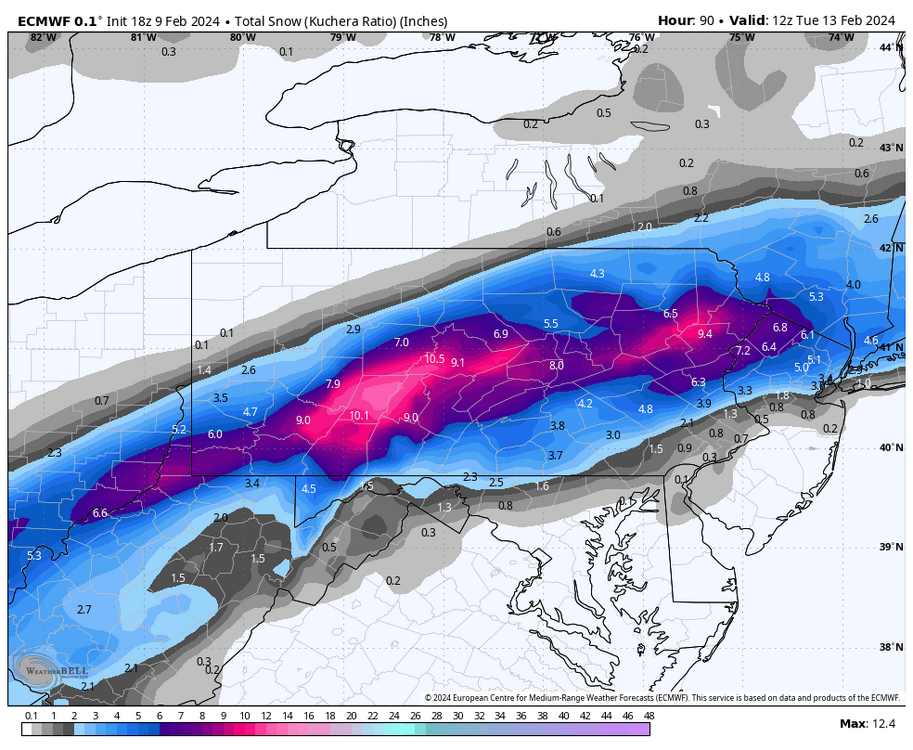
It’s a good run for sure, still snowing at 90hr in most of central/eastern PA too and quite heavily in the LSV. 1hr snowfall at the 90hr frame: Total snowfall thru 90hrs
-
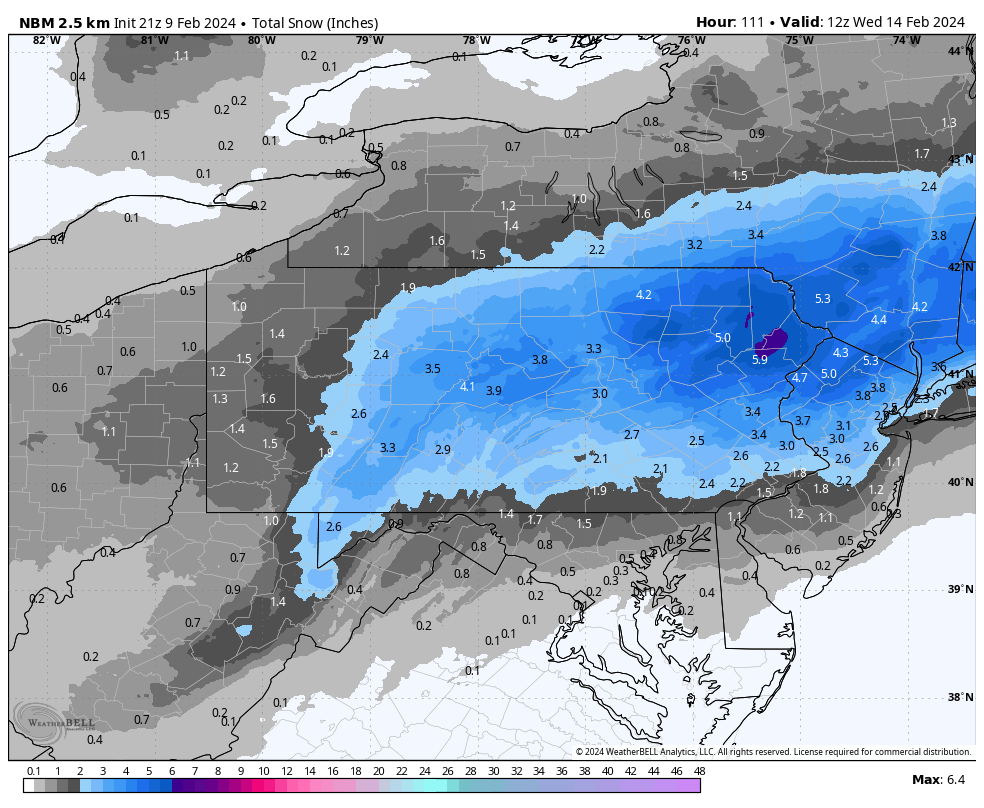
Here’s the NBM (National Blend of Models) for reference. Whenever it comes time for CTP to throw out an initial snow map, NBM is likely to factor a good bit into their map. I think this particular blend actually looks solid for the time range we’re in (D3-4). We’ll see if it eventually starts matching up some of the bigger numbers the ops are throwing out.

-
The Downfall video, lol
-
Yea it does present a longer period of rain in the Lower Sus Valley before progged changeover, a scenario I said yesterday would have a high potential to disappoint there. The southern third of PA seems to be on a pretty fine line with the guidance suite today with the last couple GFS runs edging up just a bit. Have to see how the Euro EPS looks in a bit in comparison to the GEFS. 6z Euro EPS looked pretty nice but had more of a central Sus Valley focus on the swath of best probs for >3”. Some pretty high totals on the ops, but I think this has a heaviest swath of 6-10” type potential with it (a bit more once towards New England). Definitely need the rapidly strengthening coastal low and associated dynamics (obviously without the primary cutting up too far). A weaker one probably isn’t going to get the job done in terms of initiating a meaningful changeover outside of the central/northern.
-
Euro looking generally similar to last nights 0z.
-
@Atomixwx @2001kxand I endorse that run haha. GFS has been illustrating a very well timed handoff to the coastal low underneath PA which sets up some of the best QPF in C-PA and also minimizes any issues with initial rain changing over in our region.
-
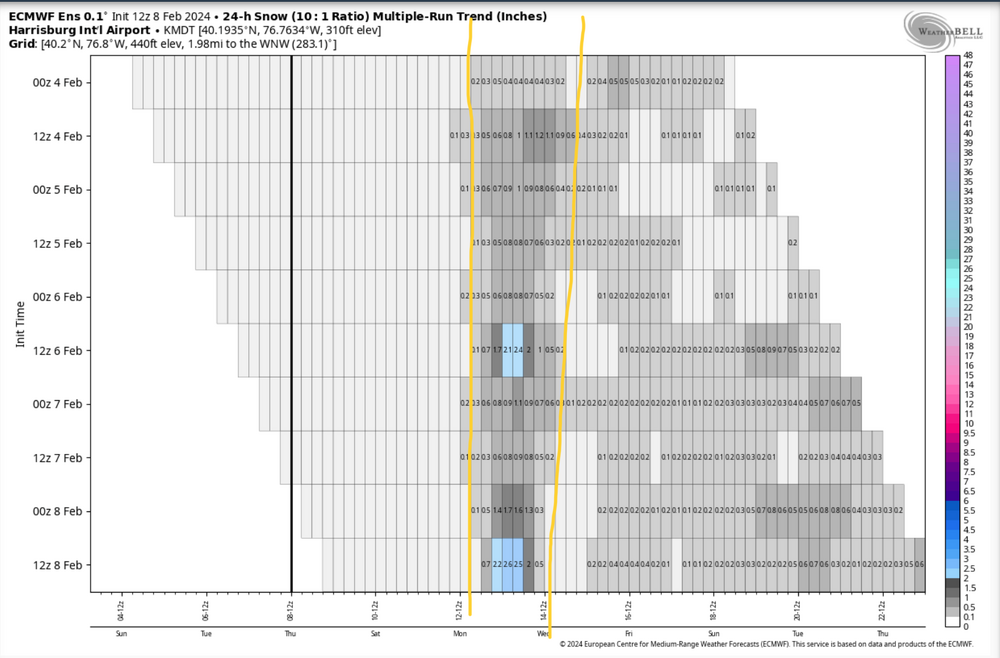
Some positive moves back the other way by the models today. Certainly still some disparity. Canadian still largely uninterested (rain) but did come back towards the other guidance some. Last night at 0z it had the rain/snow line in the NE pretty much where the GFS had the northern edge of its snow shield, so we’re zeroing in a bit. I think the GFS/GEFS is a bit generous getting a pretty significant snowfall swath thru the Mid-Atlantic. Timing/position of the low transfer will be a big factor. Most guidance seems to suggest pretty robust strengthening of the coastal low, so those dynamics will help with cooling the column. Primary up into WV before the coastal takes over isn’t necessarily a bad evolution, but we’ll have marginal cold in place.. so I’m leery of LSV spots yet. Something closer to the colder overall GFS solution would be ideal, because I think a rain changing to snow scenario has a high potential to disappoint in Sus Valley spots. Obviously don’t want to drive the primary up too far either, because aside from initial warm air push you drive north the best precip when the precip shield sets up with the coastal transfer. EC ensemble blend seemed to be the best middle ground for the 12z suite, which looked like this. 3”+ probs Individual members at MDT (24 hr snow) EC ensemble multi-run trend since 0z Feb 4, 24hr snow mean (MDT)

-
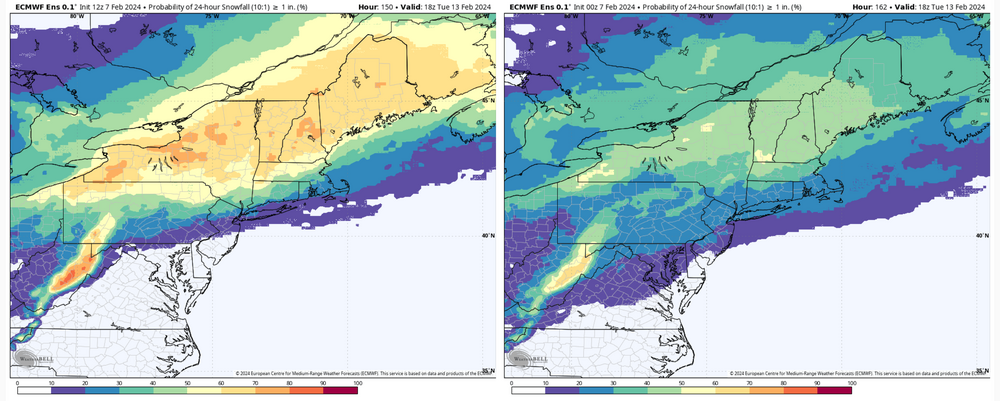
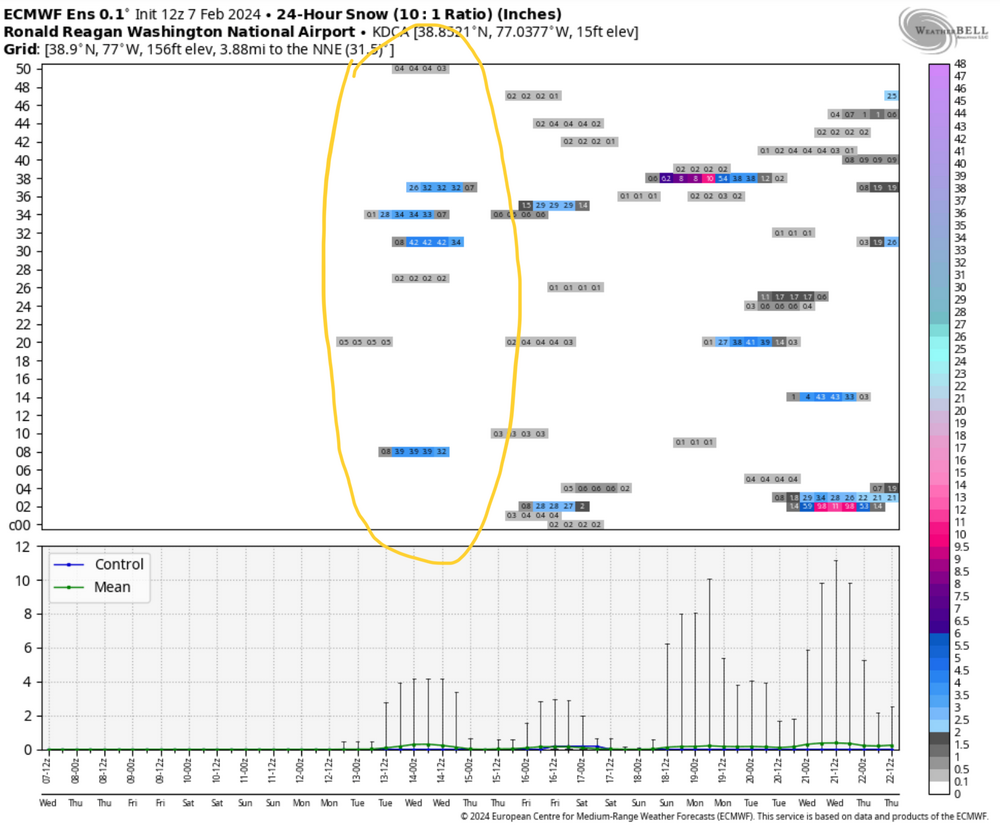
You have to dive into it deeper to get more meaningful use out of them. I utilize probabilities more at this range to try to get a rough idea on where the ensemble is focusing swath. Here’s the comparison between today (left) and 0z (right) with 24hr probs of 1”+. Both runs focused best probs on northern PA and esp interior upstate NY and northeast. The newer run really ramped up percentages while keeping the same general area of best probs because more individual members are starting to zero in on the swath. The numbers on the means in the Mid-Atlantic region on the 0z run lose their luster with the probabilities. DC was getting its 2.2” mean despite only between 10-20% of its members showing an inch or more in 24 hrs. The mean is mainly driven by two members showing more than a foot and a few showing a decent snowfall. 0z Here’s 12z, lost some of the members showing a more moderate snowfall and the two outliers that showed big numbers are showing nothing now.

-
Forum morale would be pretty rough if that actually occurred haha.
-
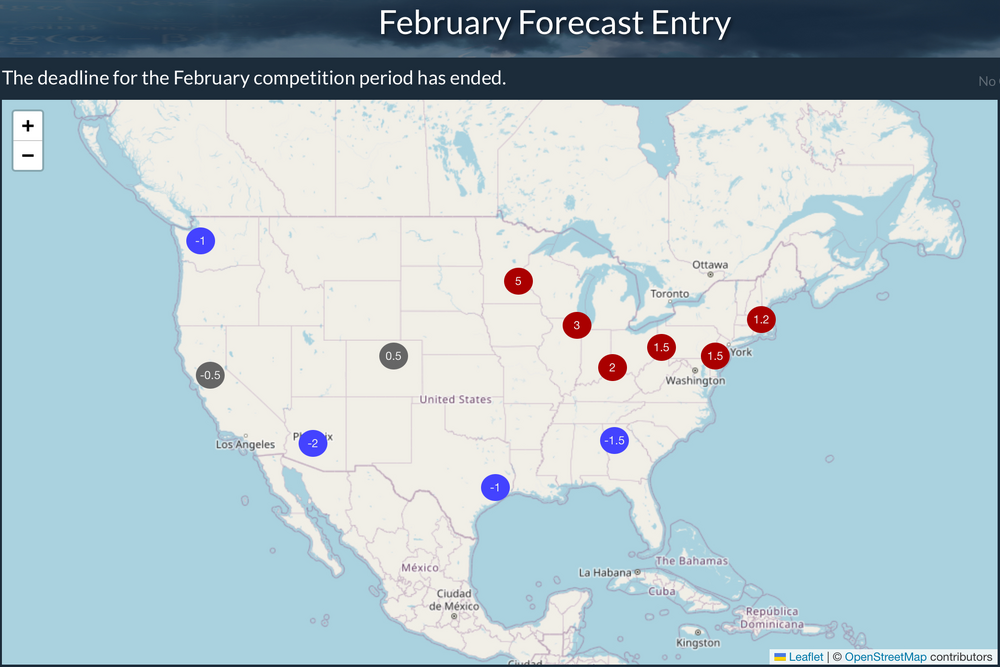
I can get on board with most of that, except the last couple sentences. Gonna have to respectfully disagree with that particular assessment for the time being. I look at that longer range guidance and don’t see much support for a wholesale shift to early spring in that timeframe. Extended stuff (GEFS Extended and Euro Weeklies) are pretty firm on maintaining -NAO/AO/EPO and +PNA throughout. MJO could eventually run the 8-1-2 phases, though I think models are still feeling that out. That alone is plenty of evidence to the contrary as things look at this point. His mention of a late stratwarm is actually on the model guidance (both Euro and GFS) beginning in earnest mid-month and stretching/dislodging the SPV. GFS op managed to actually split the SPV out in the D10-15 timeframe. Stratwarm events are hardly a sure thing, but given the lag time typically involved with one occurring, propagating downward and seeing arctic air dislodged etc…spring probably wouldn’t be springing much on or around march 10th if the arctic were to release toward the CONUS. So yea, if we’re talking early spring.. the next few days or so could be the best example of such. I’ve been putting in temp numbers for the forecast competition thing WeatherBell has been doing. Temp forecasts for the next month have to be submitted by the 20th. This was what I settled on for February back on Jan 20. If one thinks that seems warm in the north and northeast, you should see the current departures to date. Minneapolis is 18.9ºF above normal for the month so far as of today. Pitt is 10.5ºF. It better get cold second half of the month haha.
-
No spring fling on this side of the mountains today haha, it’s only 33ºF and cloudy currently after reaching 36ºF earlier.
-
I maintain my same general outlook on things that I laid out last Wednesday evening. Now that we’re about 5 days onward from this previous post, the regular op and ensemble guidance is seeing the transition in terms of teleconnections (tanking NAO/AO/EPO) but I don’t think they’re anywhere near handling features, which is likely why we’re seeing a lot of run to run discontinuity. Something storm wise is probably going to come out of that period centered on V-Day. Whether or not we have the pattern dialed in cold enough in time for that particular window to snow on us is highly debatable. There’s also multiple disturbances in that timeframe as well for guidance to decipher. The system progged to cut up and over us at the end of this week on/near the 10th would figure to set some kind of edge that the follow-up that has occasionally been progged as a snowstorm in C-PA would run. 12z Euro cut another, stronger system prior to V-day but would appear to have another wave at 240 angled fairly well to give us something decent beyond. But I guess that’s also a key point, we’re still talking D8-10+. Another thing I don’t think the regular operational/ensemble guidance is handling well yet is the transitioning MJO. Given the even further bottoming out of the SOI, we may not experience as much of a loop back in 7 and could eventually go stronger into 8 and 1 even though models aren’t really doing that right now. Not sure how the actual MJO progression is going the last couple days either, as something seems up with the MJO site (models aren’t updated past the 3rd). There’s much to be sorted out, and I’m just taking an along for the ride approach in the interim… not getting too high or low on run to run model trends. I’m not completely all in like some (or all out), but I’m confident we will see the transition to a favorable eastern US winter pattern down the stretch and there will be opportunities to be had.
-
Whether the colder Canadian ends up being right or not, this weekend thru about Wed or Thurs night looks fairly clear and we should see more typical diurnal temp ranges, with lows closer to average or perhaps slightly below (esp in the wake of the departing coastal). High temps trend more above average the later in the week one goes next week. Having more typical low temps should dampen overall + departures some.
-
43-63” on the Mammoth Mountain point and click thru Sun Night and more heavy snow beyond that next week. Guess those webcams will be the best snow fix we can get during what looks like a dry and mild upcoming week here in PA.
-
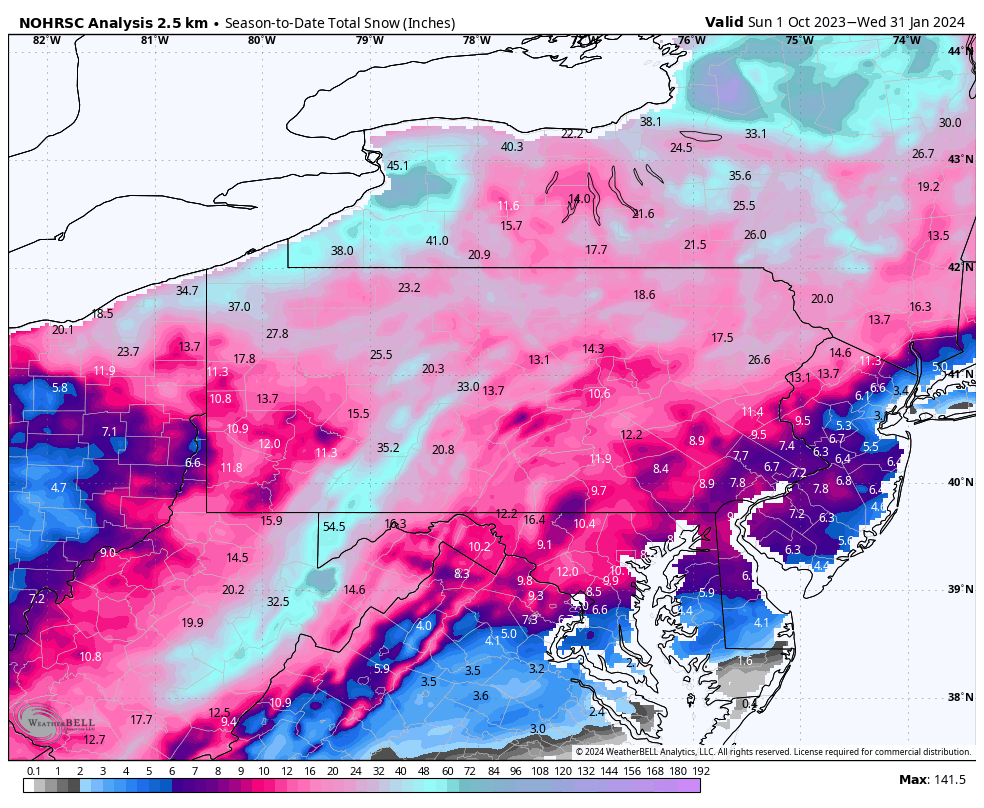
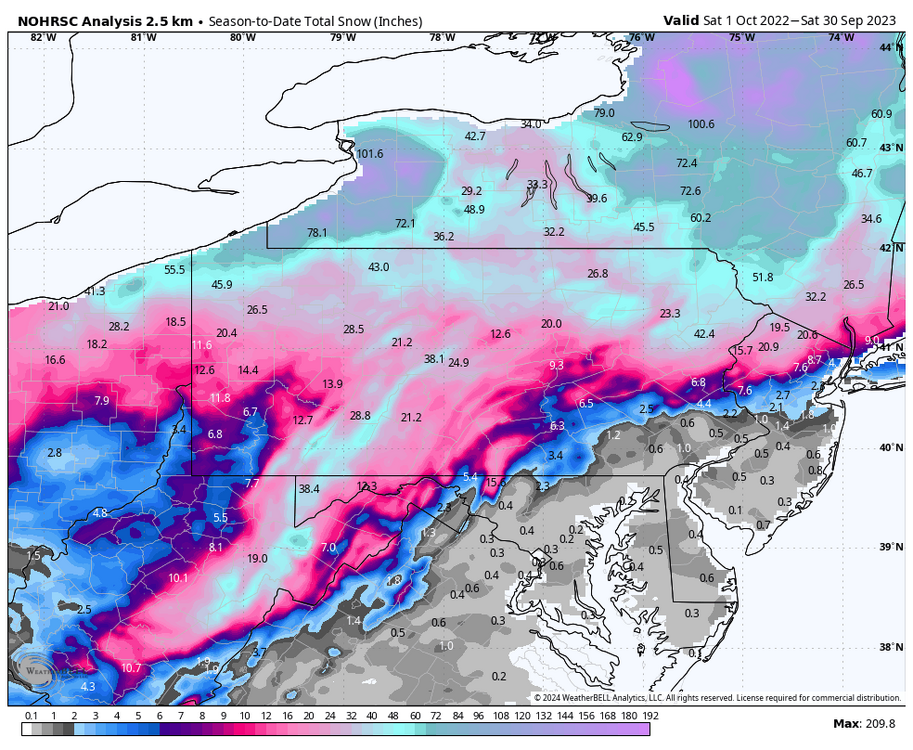
Here’s a closer version of the season snowfall map. It definitely looks way better than it did last year coverage wise. This season to date: Last winter (the entire season)

-
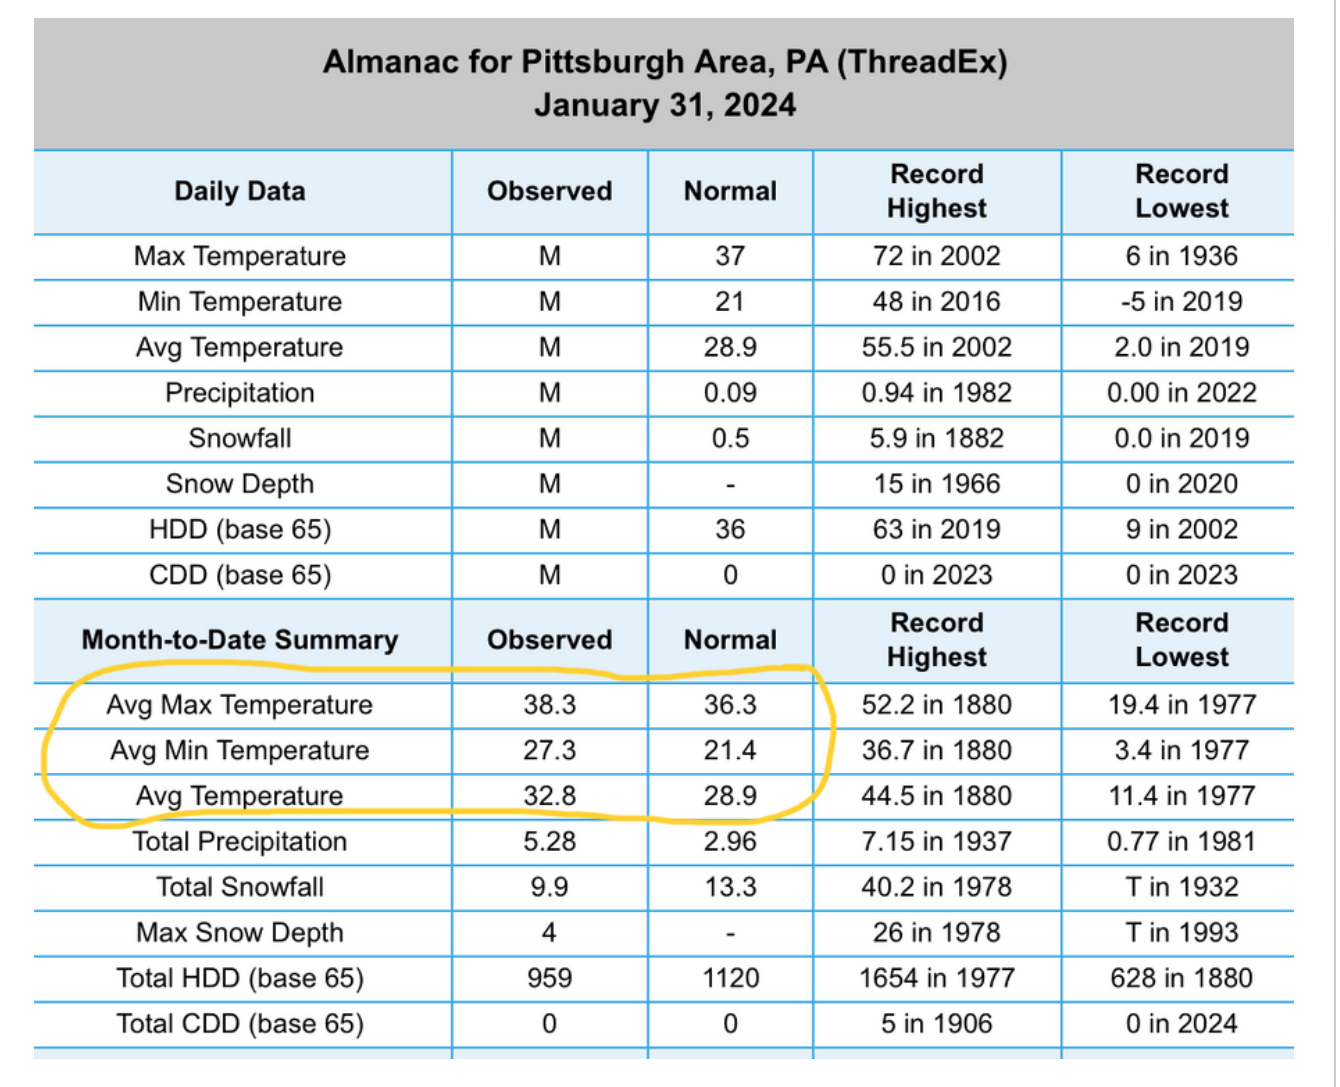
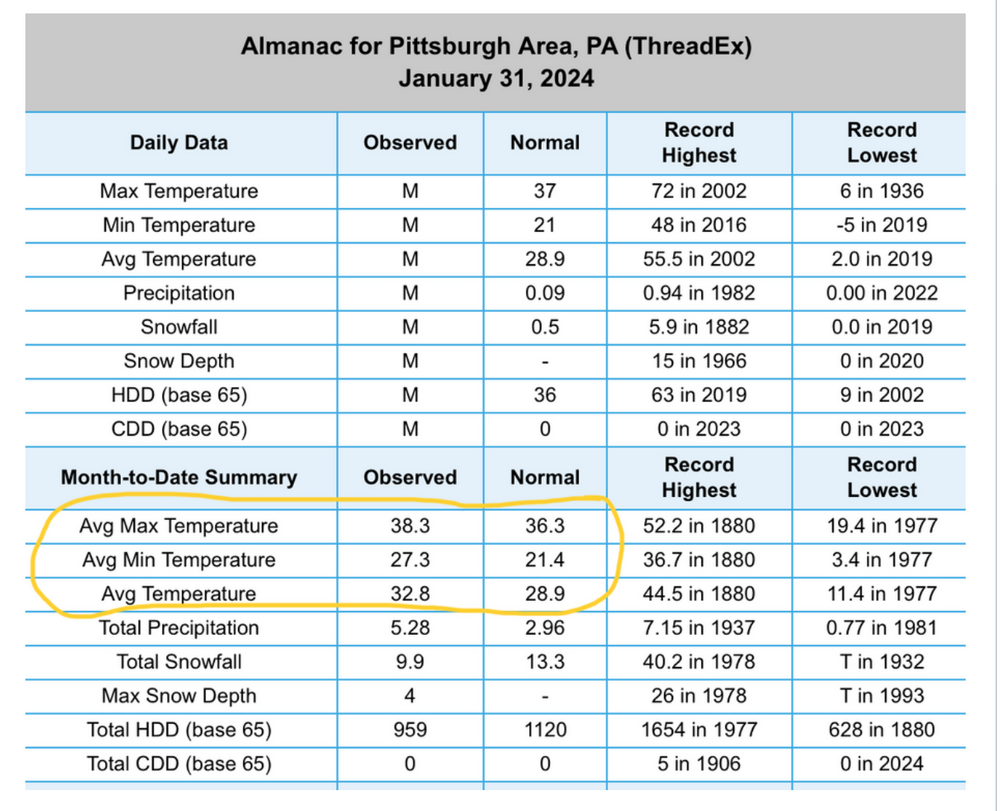
That’s really reflected on their temp departures for the month. PIT is only about +2ºF for the month for high temps, but they’re nearly +6ºF for min temps.
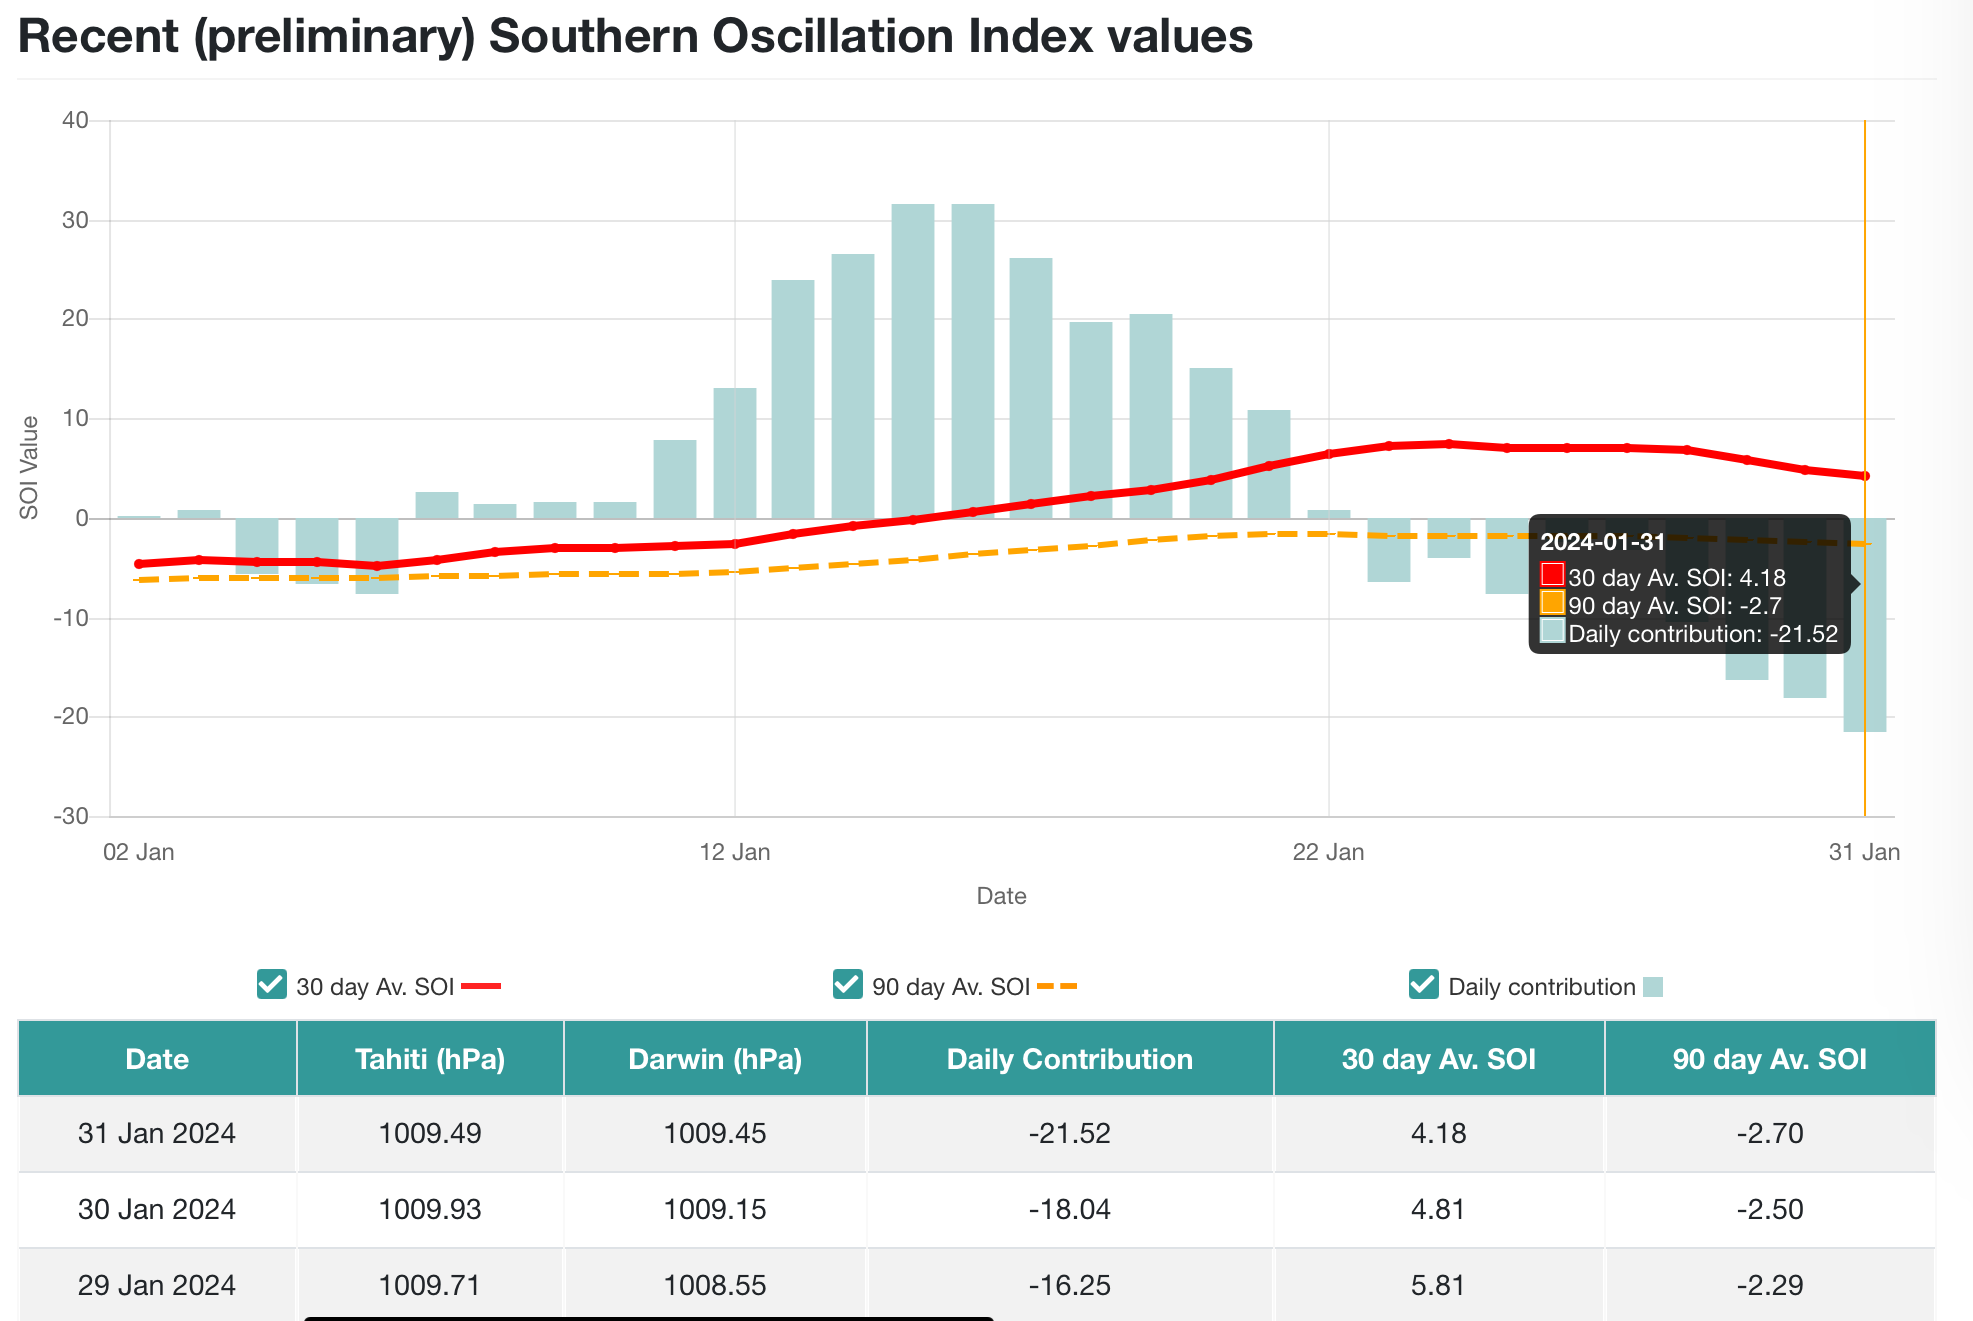
-
The reversal/tanking of the SOI continues to gain steam. The negative daily values the last few days are easily the most negative of the whole winter season. Much more in line of what is typically seen during Nino’s of stronger magnitude. And as such, the MJO forecasts continue to look set up for an eventual 8-1-2 run after its loop around in 7 the next several days. Further aligning signals are the currently very positive NAO/AO reversing and eventually developing a stronger +PNA and -EPO. Indications for a pattern shift to favor a more wintry regime in the eastern US later in Feb are strong. I said the other day I favored V-day onward for this to start talking hold and that’s about the consensus of most other folks that talk pattern here and in other sub forums. So I don’t really have much to add in that regard that hasn’t been already discussed and mapped out daily. So with that said, I feel like people’s expectations and patience could be tested in the interim. The opening 10 to possibly up to 15 days of the month look really warm.. a necessary evil unfortunately as the trough starts west and eventually shifts to set up shop in the east near the end of the regular operational ensemble guidance range as we build more Greenland ridging in the NAO realm and Western US/E pac ridging in the PNA/EPO realm. Once the influence of whatever ends up spinning around the SE coast early next week moves away, there’s going to be a period of more significant ridging and + temps that take over for a time as a trough first sets up in the west and + heights are able to build the rest of the way into the East. Here’s how we look on the ensembles the next 14 days… Week 1, stupid warm in central Canada and the northern US Week 2, warmth centered more east with western trough I’m only going to D14 with these here, but when you use the full 15-16days in the ensembles, you can see those + anomalies start fading on those temp anomaly averages (I’m using 7 day average here)… as that’s the period where models are starting to indicate the pattern shift taking hold in the east. This pattern change is a matter of when and not if, IMO.. so what we’ll be trying to nail down the next week or so is how fast/slow this occurs. I think there’s still much TBD with respect to that, since the more wholesale shift is still mostly out past D10 on guidance. This change could even come faster, but it might not… which is why I mentioned it could test people’s patience/expectations. Especially if we line up a storm window within a few days either side of Valentine’s Day and we’re not quite there yet to give many folks a widespread snow event out of it, for example. So we’ll see.. I am certainly positive on the prospects of a good later season winter run, but keeping expectations in check.
-
Also, I grade my winter here as a C- so far. What prevents me from calling it worse than a C grade is two winter storm warning verified events in 4 days (the second and biggest event to date being a straight cutter) and getting to Blue Knob two days while it was 100% open to snowboard all the natural snow on the slopes that aren’t open often or solid ice if they are. That all has since been completely wiped out and they’re closed today to fix the maybe 3 slopes they got left with any kind of base. So yea other than the period of Jan 6-20, it’s been horrendous and the only part of that period that was actually cold was about the 15-20th. I’m a sustained cold pattern and snowpack retention type.
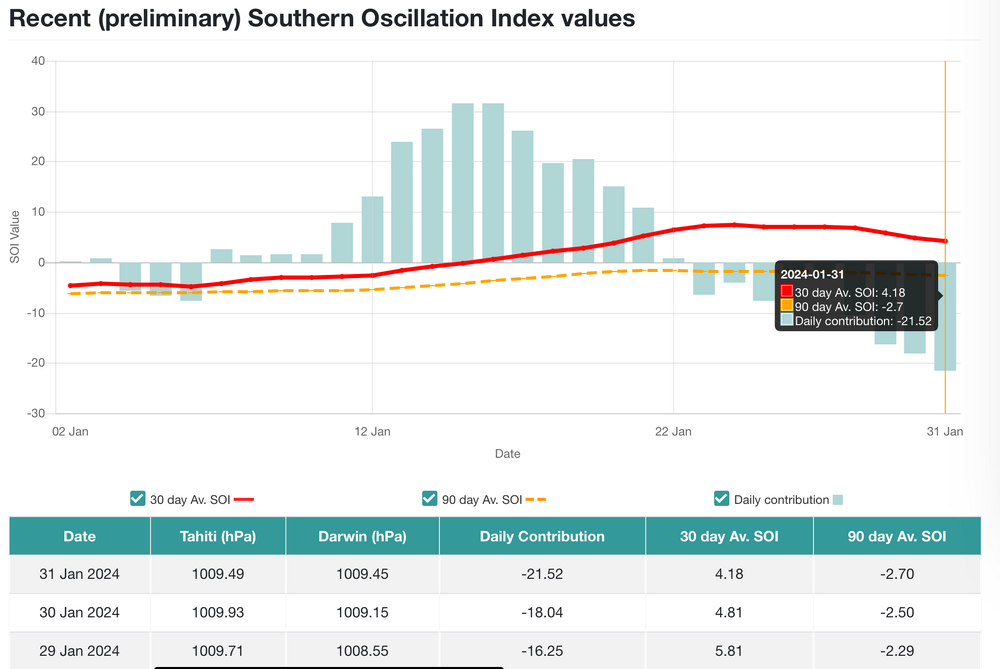
-
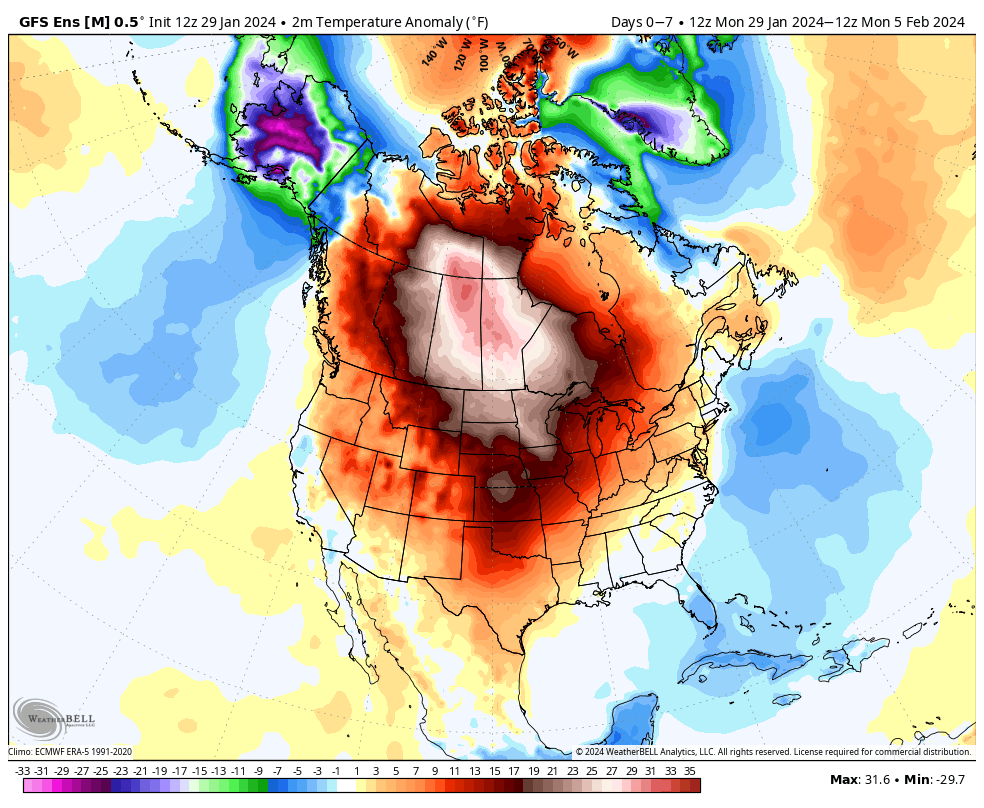
I’ve stayed fairly quiet the last few days just watching things and not jumping headlong onto the snow train (yet). My last pattern related post Thursday afternoon preceded all those monster snow maps of the weeklies/control/etc that followed it. I’ll start by saying I do think we’ll get to where we want to be pattern wise but the big question for me is the timeframe in which it takes for that to happen next month. Kind of addressed this a bit last week, at least regarding the MJO. We’ve managed to get into phase 7 but most guidance backtrack it towards and perhaps back into 6. None of the 15 day guidance makes it into 8 currently during that range but does set it up for heading that way. The extended stuff gets it there (GEFS extended, Euro weeklies) by about mid-month. So we’ll see how that evolves. I feel we need to carry a stronger pulse into those phases to eventually shuffle into the pattern alignment we’re looking for to go with what should an active southern stream. Daily SOI index is showing stronger, more sustained negative values which is more of the ballpark of where it should be given the Nino status from an SST standpoint (strong). Continuation of that would bode well for an eventual run into the colder phases. We try to nail down these pattern transitions, and typically they do eventually come… but often in some kind of a delayed but not denied fashion. So I think that’s where were at with it, especially with the meandering/backtrack of the MJO. I’m personally looking at Valentines Day onward. The writings been on the wall with our Feb 5-6 storm IMO. I haven’t really been too keen on the potential storm being anywhere near our subforum and probably not even most of the Mid-Atlantic for a couple reasons. And trust me if i was… you would have heard from me about it. First reason is this commanding ridge into Canada is simply too far east. Trough drops down into the northeast in response to the building ridge and provide some cold air from that direction (far eastern Canada) but we’re already on the backside of that trough. There’s nowhere for the southern stream wave to turn up so it’s likely going to shoot straight out until it’s way too far offshore to catch us when it turns. If we’re going to use a 2/6/10 type scenario for comparison, the highly anomalous ridging was set up thru western Canada.. with a ridge axis near the C-PA benchmark of going thru Boise, ID. Second reason is the elephant in the room most of the winter outside of the recent 10-14 day cold snap.. tons of warm air. Here’s a basic example from the 12z GEFS (2m temp anomalies). That’s a 7 DAY average of 25-35+ above normal over a large portion of Canada. Big ridging in Canada typically does come with big + anomalies for there and displacement of cold air to the south to go with the low 500mb height anomalies undercutting. It’s what makes the 500mb height maps look good. The progged temp anomalies are just huge. We have the above freezing line (at the surface) reaching the southern shore of Hudson Bay around the timeframe of this storm. I just don’t know if the airmass undercutting the ridge is going to be cold enough. I do think the southern part of the Apps (esp SW VA, far eastern Tenn, and western NC) could see a big snowfall at higher elevation. Otherwise, it will ultimately depend on the evolution of the wave itself to manufacture cold air and also to try to pull down some actual colder low level air from northern New England/eastern Ontario to get snowfall down into the piedmont region. It is possible with a more wound up coastal low, and if this storm were able to turn some it probably would be enough to snow in some interior Mid-Atlantic spots outside of the coastal plain if precip got that far north.

-
Pittsburgh, Pa Winter 2023-24 Thread.
MAG5035 replied to meatwad's topic in Upstate New York/Pennsylvania
Clipper’s haven’t really “disappeared”, we’re really just talking waves running the northern branch of the jet stream. Having anomalous ridging out west (+PNA) is what orients the northern branch to take waves over that ridge and drop them down from Alberta or a neighboring province to the eastern US to make what we call an Alberta clipper. Usually they’re moisture starved and light events but if there’s enough amplication in the pattern they can pull up some Gulf and Atlantic moisture and become more moderate events and/or phase with a southern stream shortwave and become a bigger coastal storm. Just last Friday’s event was basically a clipper type event as we’ve had some ridging out west and this wave ran the northern branch of the jet stream and tracked underneath PA. The wave just didn’t phase with southern stream energy that was around which was why it didn’t up being a more significant snowfall. But it was a pretty standard event we typically get during the winter and the downstream blocking in the NAO realm helped with the post storm LES/upslope via NW flow. My opinion is that it’s been a matter of how the mean pattern has been aligned, especially when it comes to the Pacific/western US. We’ve spent a lot of time especially the last few winters with troughs in the west (-PNA) and southeast ridging, +EPO which floods the CONUS with Pacific air, and also times of very +NAO/AO (which happened most of 19-20 and some of 21-22). These factors in combo or individually drives up the northern branch storm track in the east, which takes what would be clipper lows north of PA. It also makes a more westerly/southwesterly mean flow instead of northwesterly and that has killed the season totals in the LES/upslope areas of the Laurel’s and western PA the last several winters. The Laurel’s region has had some of the worst overall snowfall departures in the east % wise between 2019-20 and last winter. The question of why could be related to ENSO (frequent La Niña in recent winters), being in a -PDO (which favors La Ninas), etc etc. There’s been plenty of discussion/debate ad nauseam the last few winters in other sub forums of these factors and their potential influence in what has been an overall lousy run of winters in the Mid-Atlantic/NE. -
Here was the visible satellite at noon today. You can see the retreating low cloud deck and the ob sites showing the wind direction. The low level cloud deck has eroded much further since then as the warm air aloft via SW flow gets mixed down closer to the surface. Low level cool air damming from the Northeast has kept some of the Sus Valley sites cool so far today and once the southwesterly winds aloft mix out that remaining low level cool air at any one location temps will rapidly shoot up into the high 50s-60s. It’s a pretty interesting setup today, we mixed out here mid morning and reached 62ºF for a high. By the way, about 50 miles up that freezing cold river KSEG (Selinsgrove Airport) is 66 currently.
-
Temps have rocketed to 61ºF here this morning after being pretty much 36-42ºF for the last couple days. Looking back thru my obs data it’s the first time my weather station has been above 60 since November 17th apparently.