eduggs
-
Posts
5,950 -
Joined
-
Last visited
Content Type
Profiles
Blogs
Forums
American Weather
Media Demo
Store
Gallery
Everything posted by eduggs
-
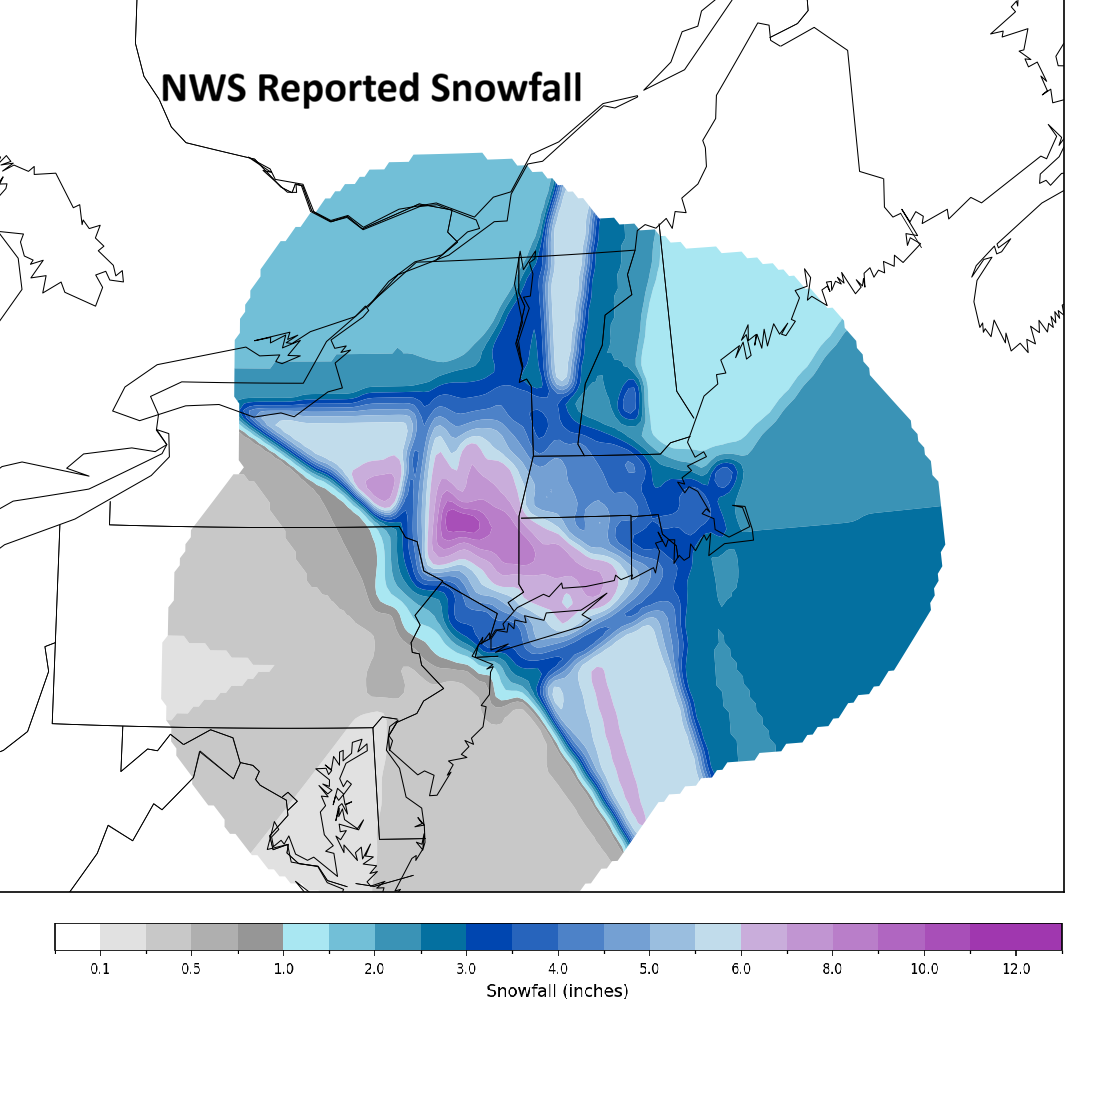
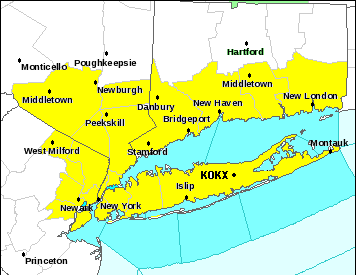
The OKX forecast zone is almost entirely NORTH and EAST of NYC. I plotted the NWS reports on the map I posted before. It shows the distribution of snowfall a lot better than the NWS PNS.
-
I was in Putnam County NY. This was NOT a 4-8" event in and around the NYC area. It was 1-5" with 6+ far north and east. It is important that we not create a false history.
-
Pattern Change is a made up concept. Every day is a unique atmospheric circulation. Sure we can identify characteristics of atmospheric circulations in real time and quantify them to create numerical indexes. But these are coarse numerical "descriptions." And none of this is very meaningful when focusing on snowfall, which is a local phenomenon and highly dependent on specific regional weather features. The bigger problem is that we cannot accurately forecast these patterns beyond 10 days. So 15 day ensemble mean charts are not very useful at identifying or forecasting weather patterns. At this very moment we can have little confidence in what the "pattern" will look like beyond next week.
-
We wish.
-
The GEFS have been shifting south for Friday night/Saturday (Jan 10). A few members take a surface low - possibly a secondary low - near or south of our region. A well timed shortwave in the northern stream might provide a just-suppressive enough flow to give us some wintry precipitation. It's kind of grasping at straws, but that's probably the next period to watch for a few runs even though this likely ends as some form of a cutter.
-
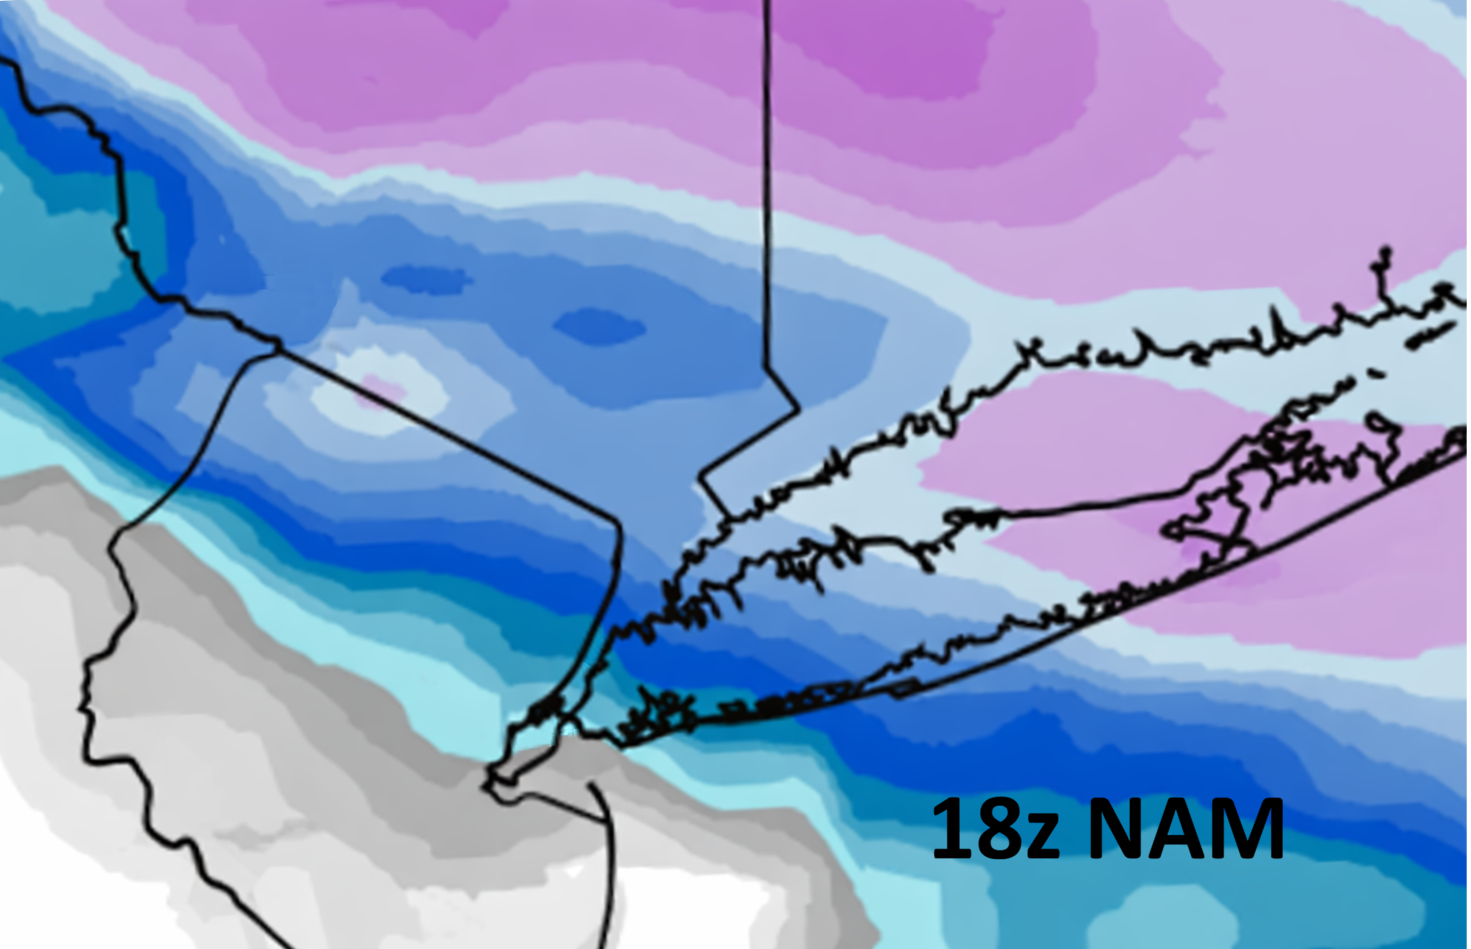
This event was 1" - 5" across the NYC metro - NOT 4" - 8".. See the circled area in the map of interpolated NWS snowfall reports below. The NWS OKX forecast area, which encompasses a large region NORTH and EAST of NYC, does not equate to the NYC metro. Don, your tables and stats are not representative or convincing, which disappoints me. A visual representation is helpful here. Even if you limit your analysis to a single 18z NAM run, it was the only model to correctly capture the sharp gradient through NYC.

-
Go back and check this. Look carefully at the maps I posted. The 18z NAM run right before the event was one of its least snowy runs. And it still showed 1-3" of (10:1) snow across Union (south) and Essex (north) Counties (EWR is right in between). Actual reports came in mostly in the 2-4" range including uncounted sleet, so about 1" off. Newark Airport at 4.3" was one of the highest reports for either county even though it's in the southern tip of Essex. The NAM was one of the few models to show sleet in Putnam County where I personally observed it. It also showed primarily sleet into Morris County before 9pm, which was also correct. It was the first and best model with the warm nose. The inv trof, which it also correctly showed lingering into Sat, was what delivered snow in NJ. I honestly think you guys arguing that the NAM did poorly are out of your minds.
-
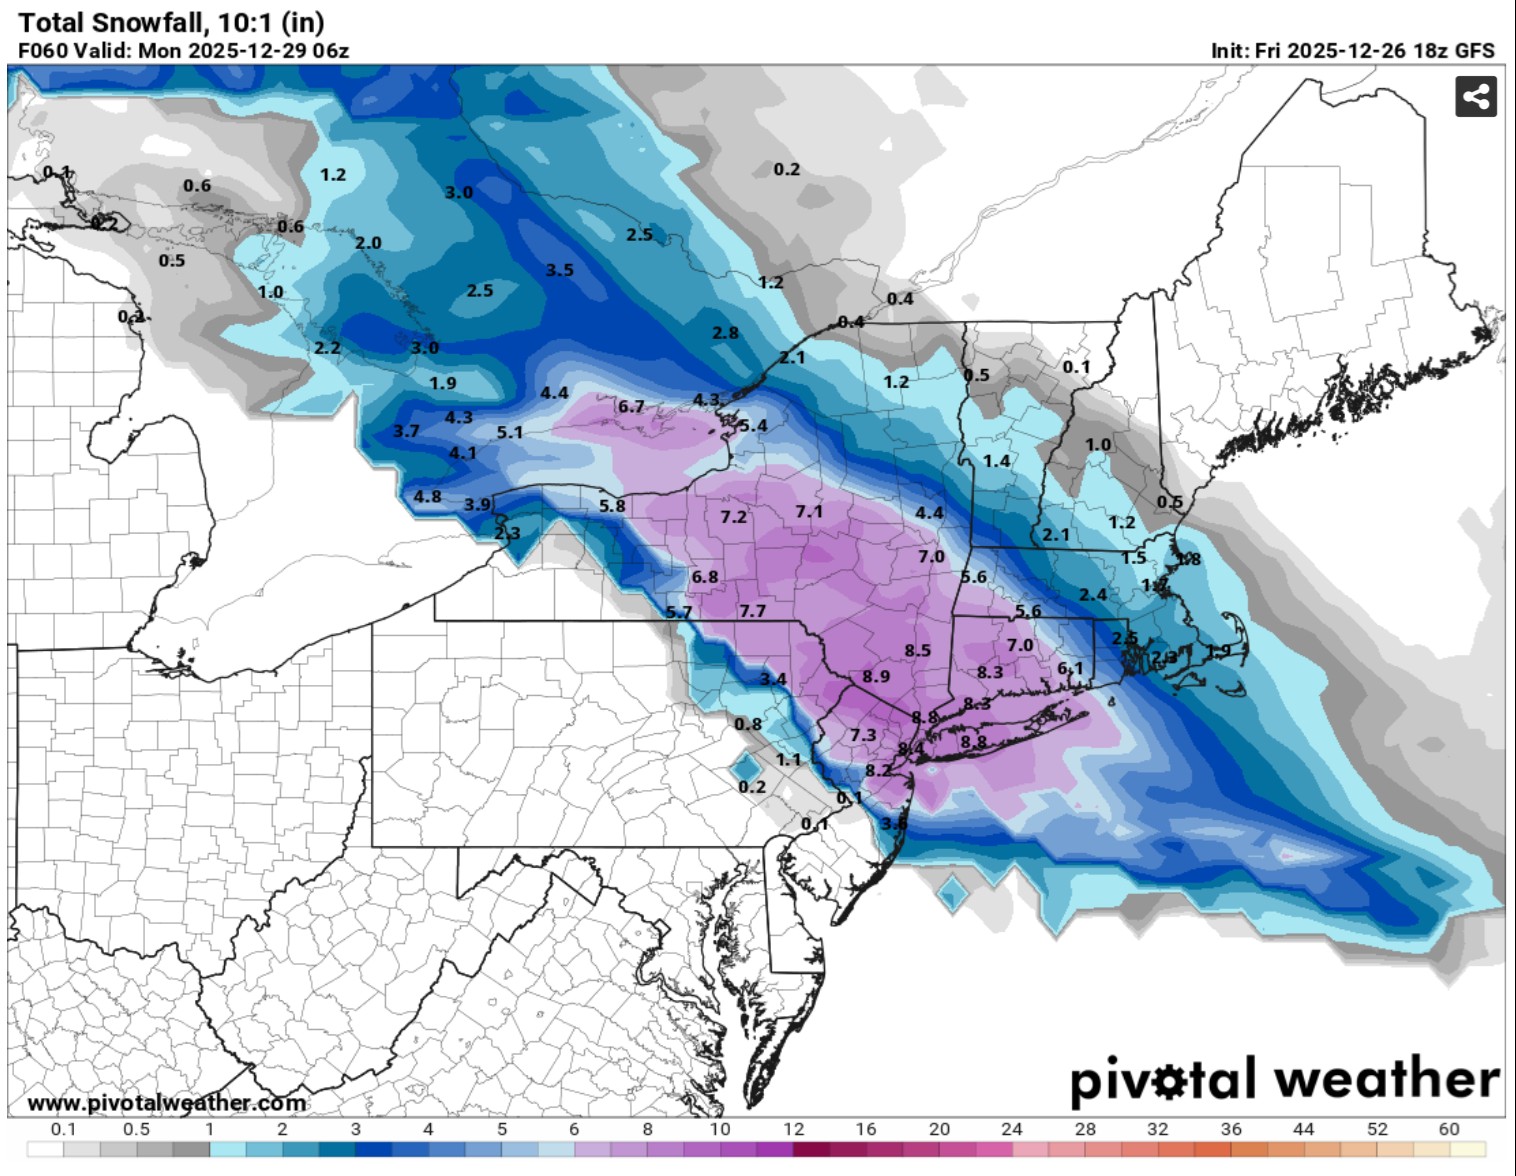
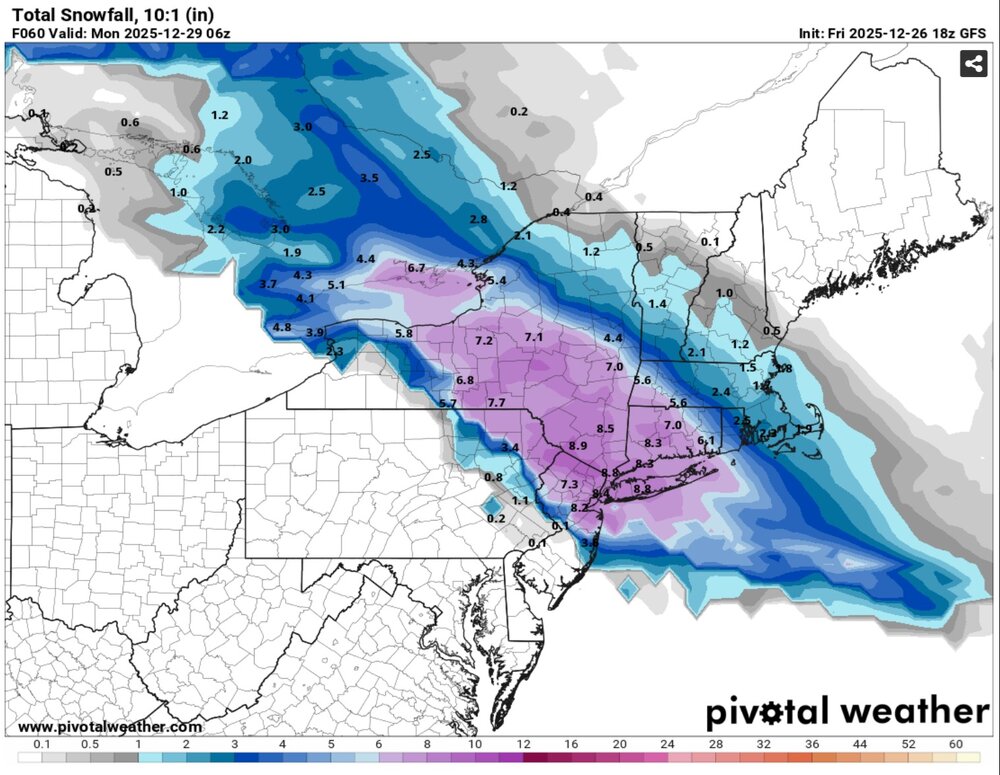
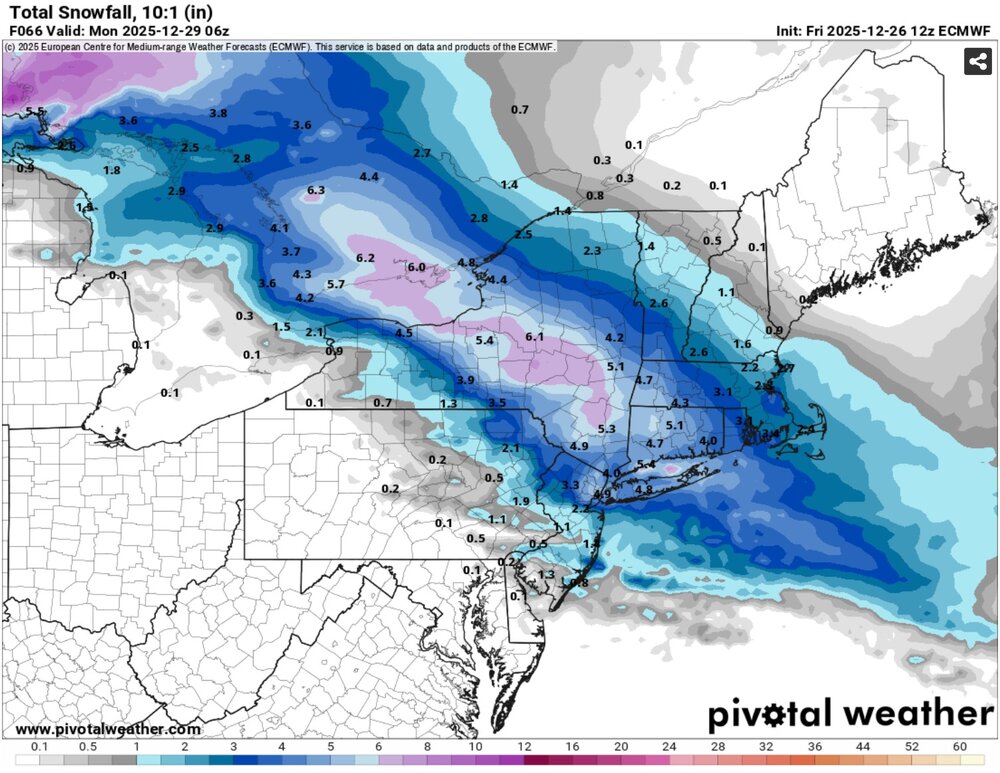
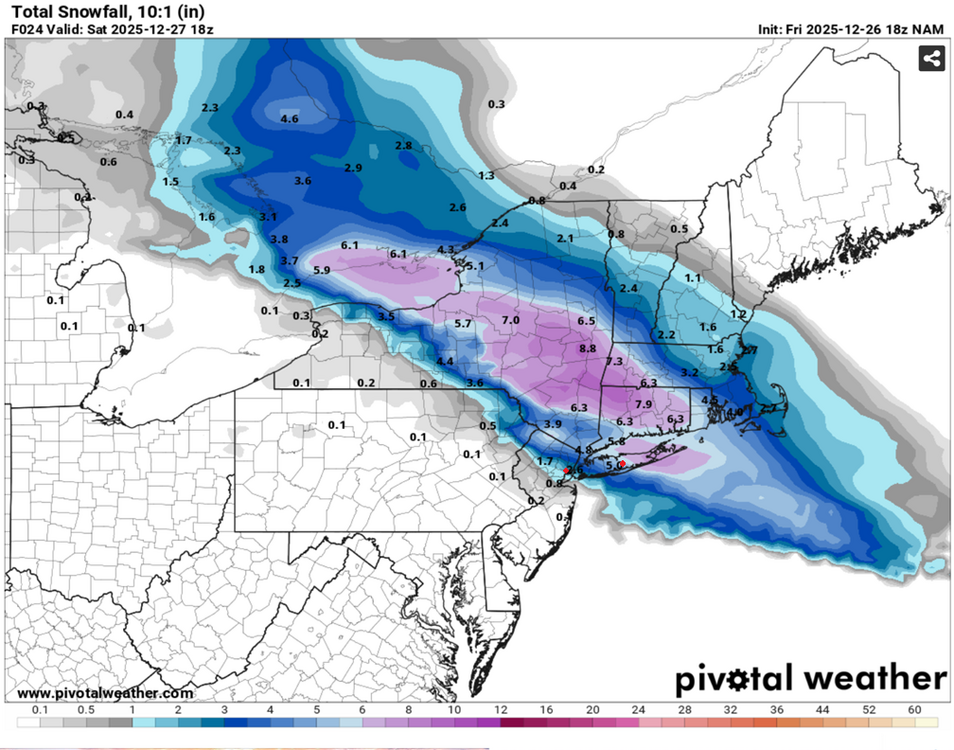
Your numbers are slightly off since you didn't include the final 18z NAM total. "Newark" was 0.8, NYC was 2.6, Bridgeport was 5.8, and Islip was 5.0". Just a few additional tenths, but it matters. I suspect the annotated value for EWR is wrong. Since Newark is north of Staten Island, that should definitely be above 1" and likely close to the value for MMU. Is it even known where Pivotal pulls these values from? The 18z HRRR was obviously way off across our area. It's way too snowy in NJ and PA and it lacks the gradient that was observed across the LHV and Long Island. Any analysis showing that it performed better than the 18z NAM across this area is seriously flawed.
-
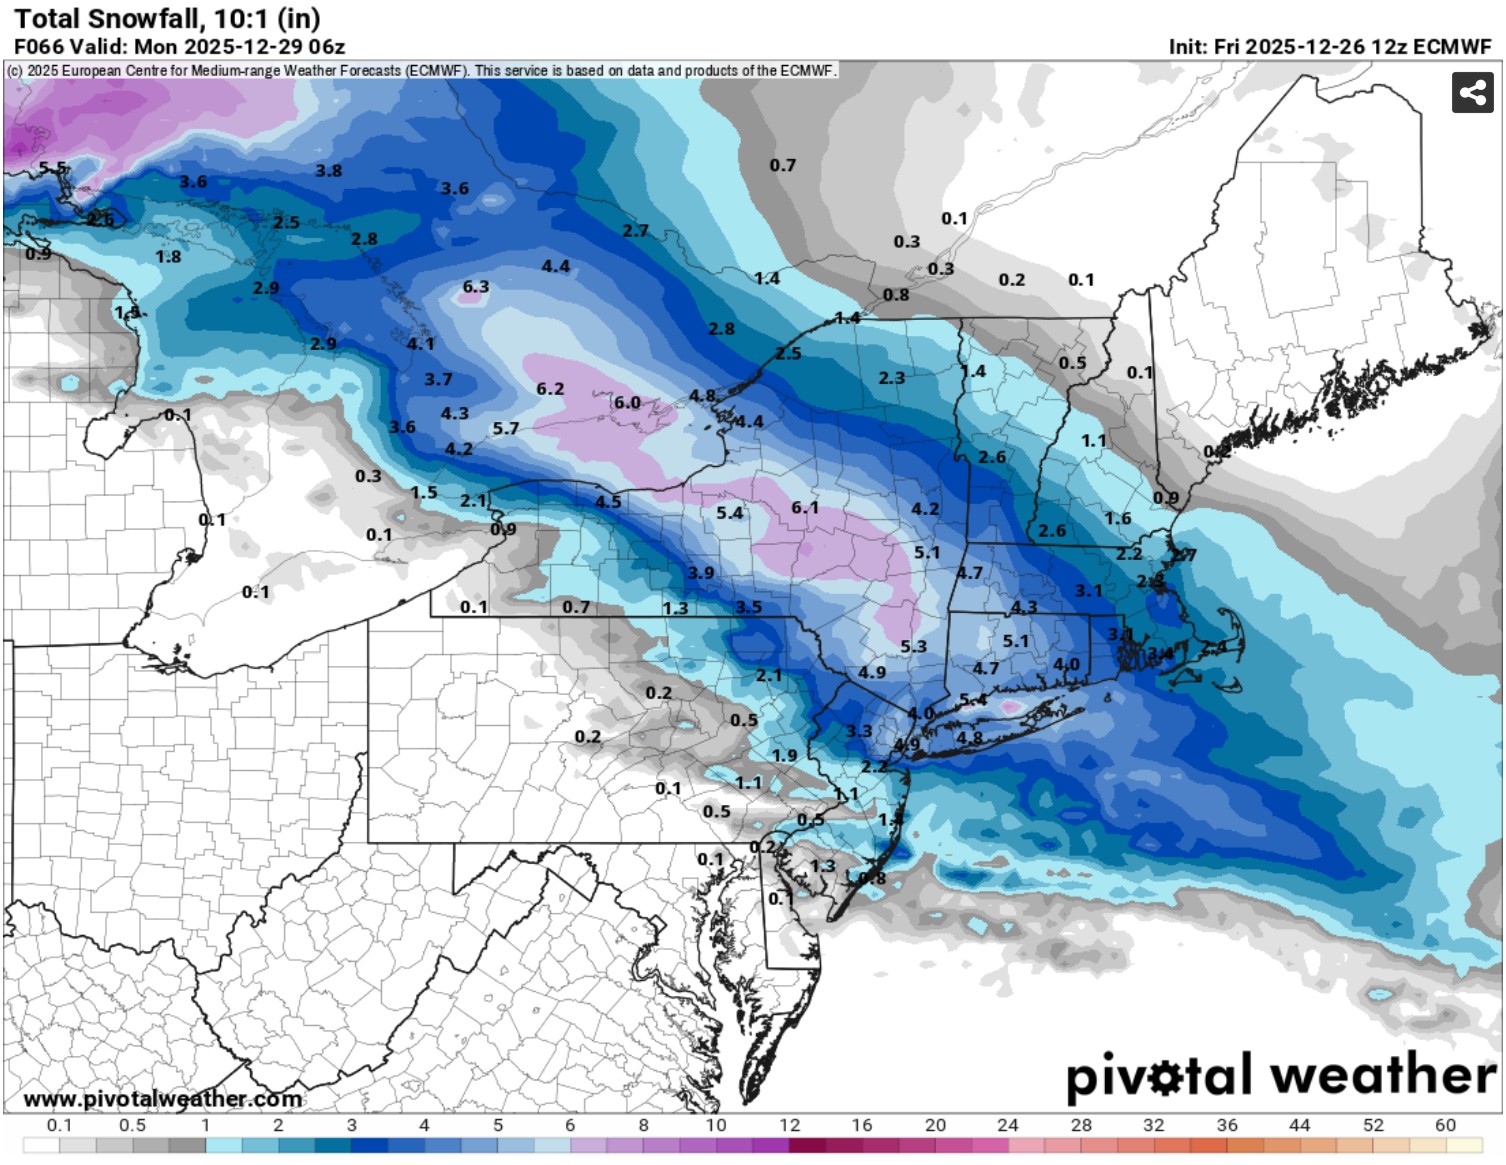
Not only did the NAM capture the gradient across our area better than all other models, it also correctly shifted north of the consensus days before the event. The ECM, for example, incorrectly still had snow in southern NJ overnight Thurs. As Don said, the NAM was an outlier during this time. BUT IT WAS CORRECT, which makes it even more impressive.
-
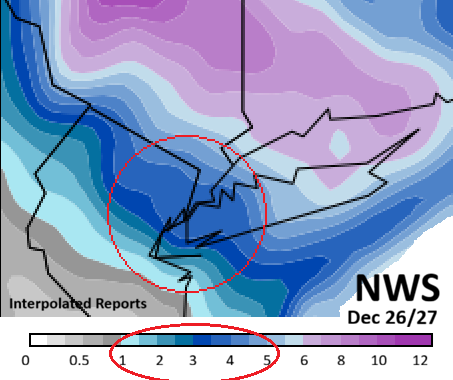
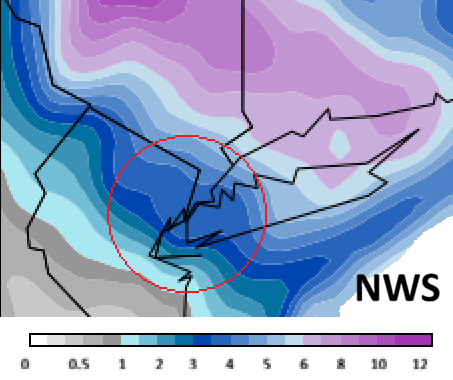
18z NAM (10:1) vs. interpolated and smoothed NWS reports (PHI, OKX, ALB, and BOS)

-
Don, where did you get your numbers for the 18z HRRR and NAM output? They don't match pivotal, so I assume you derived them somehow. But using what method? I don't think you responded to this question from earlier. To my knowledge, bufkit does not output snow/ice accumulations. Your tables also reinforce the false belief that weather models generate forecasted snowfall as output.
-
"Letter of the law" how so? All the data I've pored over supports the idea that the NAM performed best with QPF and ptype from about 3 days out until Friday afternoon. The ECM was probably second best with a late adjustment northeastward. The NAM was consistently 0.2 - 0.5" liquid across the NYC metro with a frozen ptype over its last few runs before the event. Despite "generous" final tallies for EWR and NYC, that's how it played out. It was best in the LHV, ENY, CT, and SNE. The ECM was too far southwest across the board. I'm not even sure how this is contentious. I feel like Don is/was biased against the NAM leading to a non-scientific and distorted assessment.
-
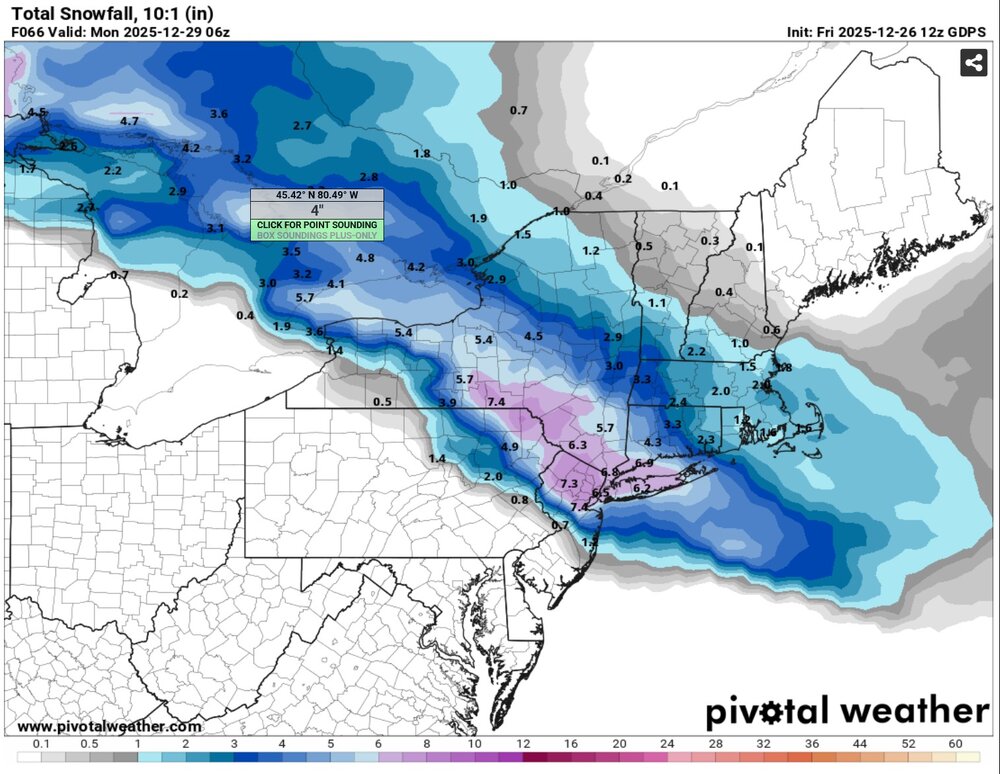
What are you basing this on? Can you share your data? My assessment does not match yours at all. I thought the NAM did great. The average of its last few runs before go time was more accurate than any other model IMO. It picked up on the track of the 700mb low and delaying its weakening. It correctly depicted the resulting dryslot across the southern tier of NY. It brought sleet past the NJ-NY border (correct). It was the first model to target and then consistently target the NJ-NY border as the dividing line between minor and significant snow, particularly with the initial overrunning. It (along with the RDPS) correctly highlighted the low-level lingering snowfall into Saturday that the globals undermodeled. Just overlaying its QPF forecast and clown maps with the reported snowfall matches up much better than everything else. The GFS, GEFS, CMC, RDPS, GEPS, HRRR, UK, ICON, and ICON-EPS were all consistently too far southwest with the heaviest precipitation, total snow, and all-snow zone. Even the ECM had too much snow in most of NJ until the very end. It also failed to show the gradient across Long Island. Hopefully you are relying on more than a single NAM run and a wonky bufkit output for one station.
-
Wounded Duck Strikes Back: Dec 26 & 27th Winter Storm Obs
eduggs replied to WxWatcher007's topic in New England
I know you were forecasting for SNE, but in case anyone is looking outside that area, the "verification" map is significantly low in ALB's region. Those reports were not final. -
I feel like you don't actually read what I write, which is a shame. Being an "old-school" poster, I put a lot of thought into what I write and it's often more than 280 characters. I thoroughly enjoyed the snow yesterday evening in Putnam County and then late last night in Morris County. I'm certainly not complaining. I'm trying to make a point about the NAM so that people are less likely to make the same mistake during the next event.
-
Don was ripping the NAM before and during yesterday's event. It should be obvious to anyone that the NAM (from ~60 hours out) performed better than the NWS and most other guidance for our area. Don was wrong. If he wants to do a verification of the NAM, he should do it with a more precise parameter than reported snow accumulation. At the very least he should use more than 4 stations. I think the NAM is getting hosed in Don's "verification." A few of the entries look wrong. There's also the issue of sleet: EWR and possibly Central Park experienced some sleet yesterday evening. If this was the dominant ptype during any time point, pivotal will record it as 0 snowfall for that period. But since sleet accumulates, using the pivotal algorithm will under-predict accumulated snowfall. I think the entire purpose of the verification when it was originally proposed was to bash the NAM, assuming it would fail. But it did not. The writing was on the wall early yesterday (HRRR, RAP, ECM, radar). Some noticed. Others doubled down .
-
But that's the question. How does Pivotal retrieve the raw data? It's suspicious that the NAM would output so much more "snow" for MMU than EWR considering their relative locations and the general snowfall distribution it was predicting. I'm wondering if it pulls the raw data from a location further southwest than the airport.
-
The numbers from the 18z 12/26 NAM run on Pivotal (which doesn't add anything to the totals for sleet) were: Bridgeport: 5.8 Islip Airport: 5.0 Central Park: 2.8 Newark Airport: 0.8 However, the annotated totals shown for NWS reporting stations don't match the colored boundaries drawn on the map. I've marked Newark Airport and MacArthur Airport with red dots as an example. Based on the graphical boundaries and the legend, the estimated NAM totals are: Bridgeport: 5.5 Islip Airport: 5.5 Central Park: 2.8 Newark Airport: 1.8 So now I'm wondering how the values shown on Pivotal get populated. Is the data drawn from the exact lat lon of the reporting station cross referenced to the raw NAM data, or is there some kind of apprimation going on...?

-
Where did you get your 18z NAM numbers?
-
Middletown is a funny case. For the Tue event the NWS hoisted a last minute WAA and the area ended up with warning snows. For this relatively long lead WSW event, I believe that area ended up in the upper tier of advisory snows. Snow is very difficult to accurately predict.
-
Couple minor comments: on the 18z NAM snowfall map I looked at on pivotal at 10:1, Islip was 5.0, NYC was 2.6, and Newark was 0.8. But the colored graphics look wonky - I'm not sure how accurate they are. Point and click shows about 2" for Newark. It shouldn't be much different than MMU considering their relative lat lon positions. Secondly, I don't believe those numbers count sleet. I believe the algorithm ignores accumulated sleet and only displays the snow equivalent. So some sleet accumulation (NYC and EWR) would lead to underestimation. Since snow accumulation is a very inexact metric to both forecast and measure, I don't believe a subset of reported snow totals is a good method to assess model verification.
-
It looks like officially NYC got more snow than BOS. But the greater Boston area received about the same amount of snow as the metro NYC area. It sure didn't look like that would happen 2 or 3 days ago.
-
Don't ignore the NAM inside 48 hours. Yes, it's prone to bigger run-to-run shifts than the globals, but its multi-run trends are meaningful. And it wins more often than any other model when it's a perceived outlier. And to counter potential false memories, the NAM 36 hours ago had some support from the ECM. When the short range models plus the UK and others started to follow suit, it should have gotten more attention. This really could have been better forecasted if people hadn't ignored the best short range model we have for this kind of forecast. In any case, most of us woke up to a beautiful morning today!


-
Nice f'in job by the NAM yesterday at go time. It nailed the jackpot zone, the 3-4" across NYC metro, 4-6 LHV, and less in NJ. It even showed the inv trof lingering into daylight hours today. Sure you can quibble about minor misses here and there (remember this is 3rd party estimated at 10:1)... like it had more sleet than snow overnight in NJ which slightly underestimated final totals there and SWCT might be a little low. But with snowfall forecasting, no forecast map is ever perfect. But the NAM was hands down the winner. GFS performed horribly.

-
4.3" In basketball parlance we'd call that a make-up-call.