eduggs
-
Posts
5,951 -
Joined
-
Last visited
Content Type
Profiles
Blogs
Forums
American Weather
Media Demo
Store
Gallery
Everything posted by eduggs
-
Extreme Cold, Snow & Sleet: SECS 1/24 - 1/26
eduggs replied to TriPol's topic in New York City Metro
ICON with a nasty gradient north of NYC. 6" for JFK with 2' in Orange and Putnam. -
Extreme Cold, Snow & Sleet: SECS 1/24 - 1/26
eduggs replied to TriPol's topic in New York City Metro
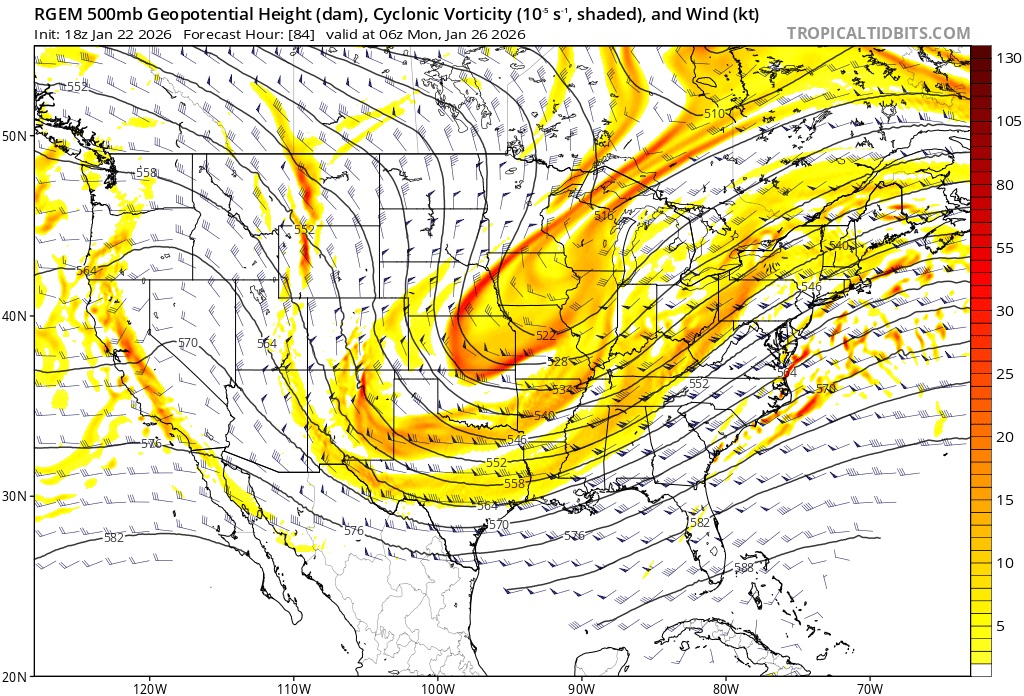
With this kind of high amplitude trof hanging back over the central US on the RGEM there's a chance a surface reflection lingers on Monday and we could score a bit more snow. SNE has a better chance, but we still have a shot to extend this.
-
Extreme Cold, Snow & Sleet: SECS 1/24 - 1/26
eduggs replied to TriPol's topic in New York City Metro
Yikes on the RGEM. Sleet comes in really fast. 12 hours of snow would be great. But that's not a long duration snow event and we're greedy. -
Extreme Cold, Snow & Sleet: SECS 1/24 - 1/26
eduggs replied to TriPol's topic in New York City Metro
Nice run from the RRFS as well. 1" liquid all snow for most of our area as precip. lightens up late Sun. with the dryslot. It looked a tick cooler than 12z. The details don't matter that much at this point. But what I think is important is that we stop seeing further north trends. So far with the NAM and RRFS at worst the northern solution appears to have held. If we go much past this point it becomes increasingly difficult to reverse the trend at the last minute and we start introducing the possibility of ZR to CNJ and even rain for the S & E coasts of NJ. -
Extreme Cold, Snow & Sleet: SECS 1/24 - 1/26
eduggs replied to TriPol's topic in New York City Metro
Yup, cooled a touch across our area. Pretty solid CNJ north with sleet and dryslot at the end. Very curious if there would be any snow on Monday from that trof back to the west. -
Extreme Cold, Snow & Sleet: SECS 1/24 - 1/26
eduggs replied to TriPol's topic in New York City Metro
Just saw the 15z SREF mean 500mb flattened a bit compared to 9z... just probing for good news. They were super amped to start but any shift in a better direction is welcomed. -
As shown that's a snow sounding. But in reality when the ECMWF model sounding looks like that, it usually verifies as sleet. Either the model or more likely the 3rd party vendor lack the vertical resolution to properly depict the sounding. That's why the plot looks too linear and granular. Using the NAM as a reference, there's probably a warmer layer in there below 700mb.
-
Extreme Cold, Snow & Sleet: SECS 1/24 - 1/26
eduggs replied to TriPol's topic in New York City Metro
They generally don't like to make big changes shift to shift to avoid a windshield wiper effect. Heavier snow to the south reflects the model consensus from a day or two ago. If the further north solutions persist, future maps will gradually reflect that. -
Extreme Cold, Snow & Sleet: SECS 1/24 - 1/26
eduggs replied to TriPol's topic in New York City Metro
Should be interesting model runs later today and especially tonight. We are riding the edge between a significant event and something historic. A small shift either way from this spot will make a huge difference in the feel and impact of the event. -
Extreme Cold, Snow & Sleet: SECS 1/24 - 1/26
eduggs replied to TriPol's topic in New York City Metro
Just a reminder that 850mb is not the warmest layer. The warmest NAM layer (in between 850mb and 700mb) is several degrees C warmer than 850mb. -
Extreme Cold, Snow & Sleet: SECS 1/24 - 1/26
eduggs replied to TriPol's topic in New York City Metro
Sleet walks are much less enjoyable than snow walks. -
Extreme Cold, Snow & Sleet: SECS 1/24 - 1/26
eduggs replied to TriPol's topic in New York City Metro
I'll be following the ECM-AI closely too. Anecdotally it's done great this year. That and the NAM for how far north mixing gets. The AIs plus CMC are pretty amped - it looks like that's where we're headed. The GFS is heavily discounted in my mind. -
Extreme Cold, Snow & Sleet: SECS 1/24 - 1/26
eduggs replied to TriPol's topic in New York City Metro
Sure everybody would enjoy a 6"+ thump on Sunday. But it's much more enjoyable if you don't have to sweat the pending sleet. The hypervigilance for the tell-tale signs of change over distracts from the experience. -
Extreme Cold, Snow & Sleet: SECS 1/24 - 1/26
eduggs replied to TriPol's topic in New York City Metro
Yeah the ratio thing is silly. But I still think a 12+ solution in possible. The 6z ECM/ECM-AI looked solid. Same with the 12z RGEM. We just have to hope for a flatter shortwave across the mid-south and mid-west in the run up. -
Extreme Cold, Snow & Sleet: SECS 1/24 - 1/26
eduggs replied to TriPol's topic in New York City Metro
This is the concern right here. The Delmarva, SNJ, CVA up to DCA were progged for 12+ for days (still might get it). But the NAM warms the mid-levels so fast that the duration of snow is too short lived for major (6+) accumulations. If this keeps trending in the same direction, we are at risk for a similar fate. It has happened many times in the past and often in hindsight people say it was obvious with a trof axis so far west. Fortunately the NAM is also sometimes too amped at this range. But it should not be completely dismissed.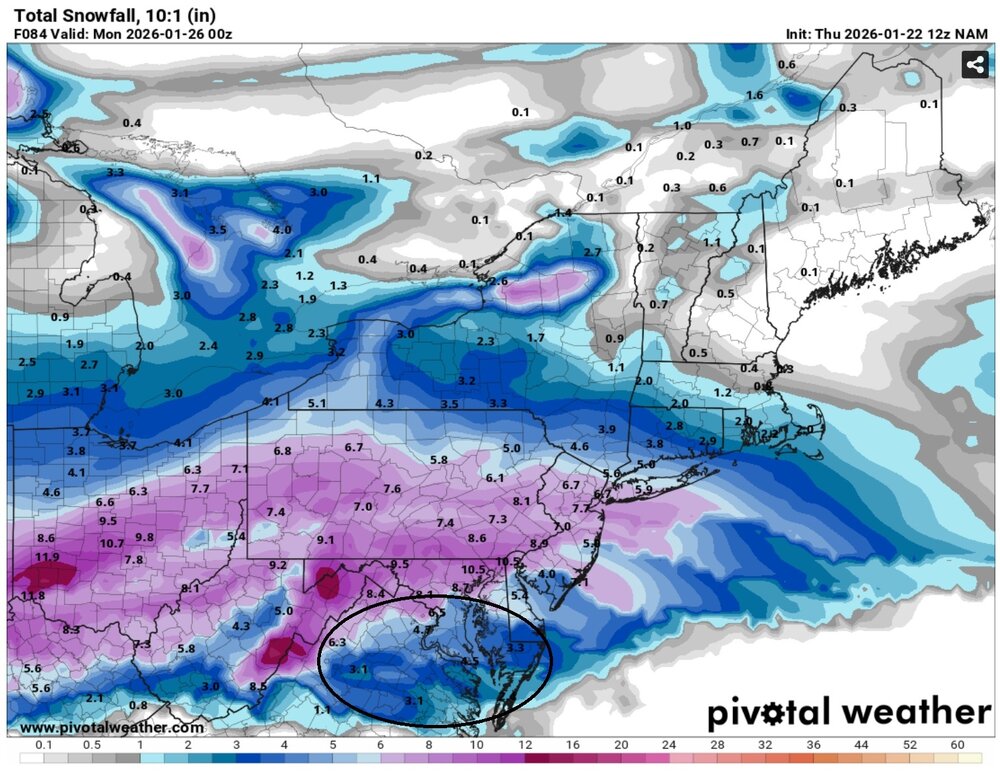
-
Extreme Cold, Snow & Sleet: SECS 1/24 - 1/26
eduggs replied to TriPol's topic in New York City Metro
What's wrong with describing what the model shows? -
Extreme Cold, Snow & Sleet: SECS 1/24 - 1/26
eduggs replied to TriPol's topic in New York City Metro
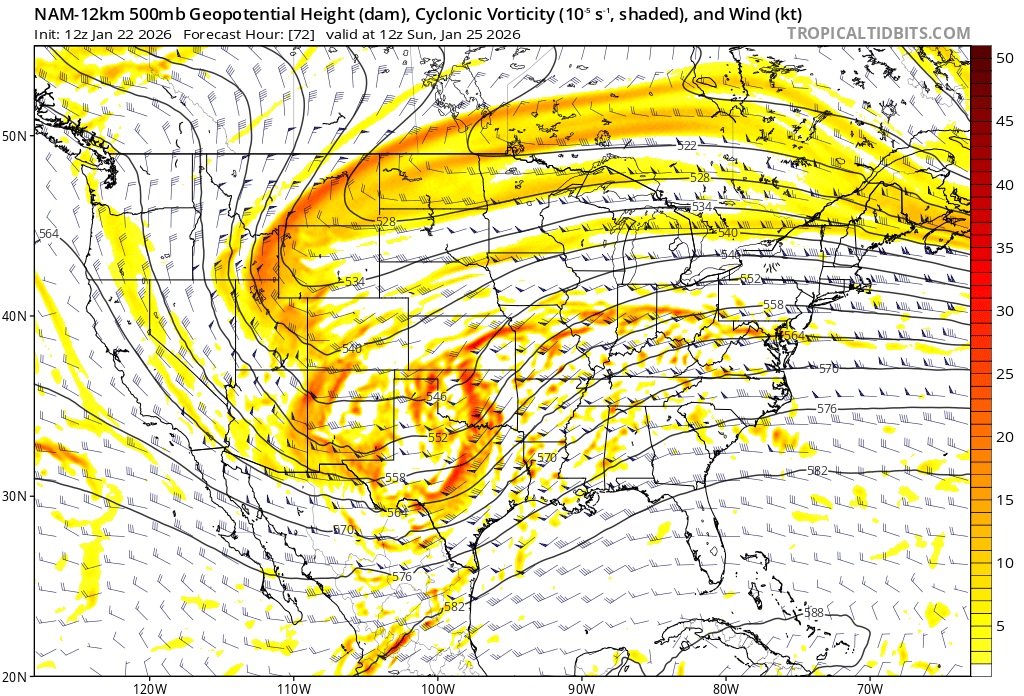
Disagree about the NAM. Look at this shortwave over OK at 72hr. Takes it straight to Chicago. That's sharper than 6z. Will take a primary and pronounced mid-level lows to WPA and then NYS. No way to block that mid-level warming Sunday afternoon with that upper level setup. Other guidance is less sharp... but NAM is good at this. Let's hope it's still beyond its accurate range.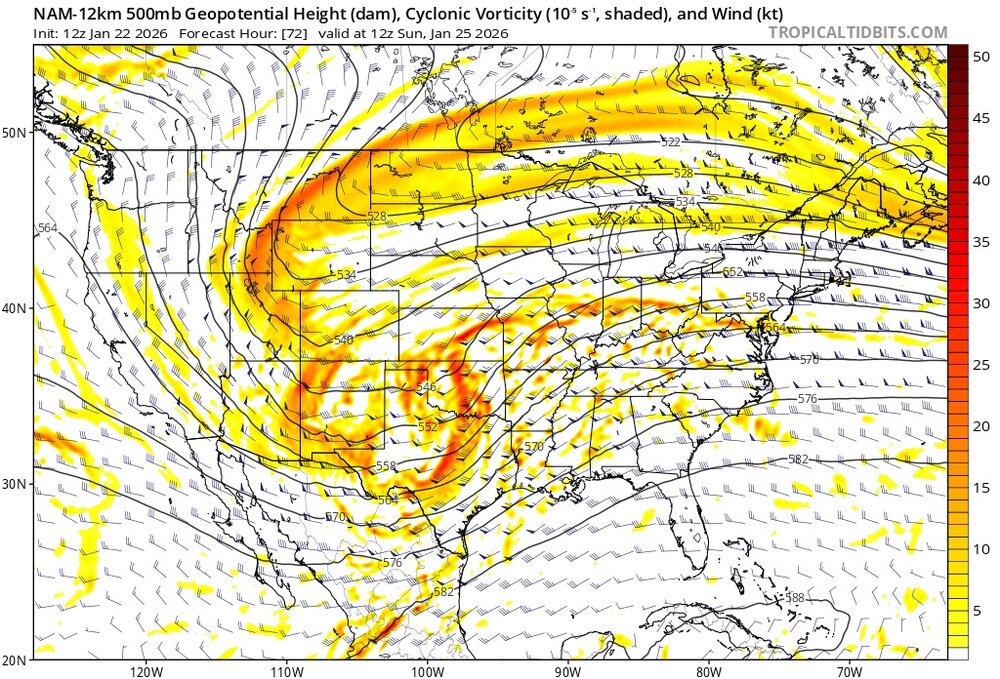
-
Extreme Cold, Snow & Sleet: SECS 1/24 - 1/26
eduggs replied to TriPol's topic in New York City Metro
God the NAM is super amped. 12z even moreso than 6z. That would end up as a lot of sleet - ZR even towards the end. Pray it's wrong. ECM, ECM-AI, and GFS looked solid overnight however. -
Extreme Cold, Snow & Sleet: SECS 1/24 - 1/26
eduggs replied to TriPol's topic in New York City Metro
Everybody knows wet means high QPF. Especially in this context. Not literally rain. -
Extreme Cold, Snow & Sleet: SECS 1/24 - 1/26
eduggs replied to TriPol's topic in New York City Metro
"Wet" as in intense rates, which is true considering it falls in about 12 hours. Temps between 700mb and 850mb surge during the day on Sunday and no longer support snow by Sunday evening for much of the forum. It's a high impact event but shorter in duration than some other models. -
Extreme Cold, Snow & Sleet: SECS 1/24 - 1/26
eduggs replied to TriPol's topic in New York City Metro
That's a sad look for Sunday night. Mid-levels too far NW resulting in a persistent primary low and no lift for our area. -
Extreme Cold, Snow & Sleet: SECS 1/24 - 1/26
eduggs replied to TriPol's topic in New York City Metro
It would be interesting if DCA outdid PHL, NYC, and BOS in terms of snowfall due to a stronger and longer initial overrunning. I doubt it mostly because of likely better ratios up north and possibly some tack-on snow at the end. But I guess it's possible. -
Extreme Cold, Snow & Sleet: SECS 1/24 - 1/26
eduggs replied to TriPol's topic in New York City Metro
The Euro is also faster to move out than the UK, ICON, and GFS. 12 hours of snow plus or minus and then dryslot/light stuff. Most of the steady precip. is done by 0z Sunday on the Euro. -
Extreme Cold, Snow & Sleet: SECS 1/24 - 1/26
eduggs replied to TriPol's topic in New York City Metro
Euro looks wet and warm. No major reversal to the north/amped trend but still a major event. -
Extreme Cold, Snow & Sleet: SECS 1/24 - 1/26
eduggs replied to TriPol's topic in New York City Metro
It's more amped. Powerfreak gets crushed up at Stowe. That's usually not great for our area.