raindancewx
-
Posts
3,847 -
Joined
-
Last visited
Content Type
Profiles
Blogs
Forums
American Weather
Media Demo
Store
Gallery
Everything posted by raindancewx
-
Gotta watch the possibility of a tropical system blowing up in the Gulf of Mexico and smacking Texas over the next ten days.
-
Elephant Butte Water level has been over 20% for 3.5 weeks now, currently up 16.5 feet from this time last year. Pretty impressive to see, as the longer it stays over 20%, the more water NM gets to keep for storage.
-
Mountains and higher valleys in the northern half of New Mexico got pasted with this system - definitely the most snow I've seen from a late system here. I was asleep until 2 pm but it seems to have snowed at the airport around 7 am and then again around 11 am, and it stuck enough to dust the ground. I didn't have any days in March in Albuquerque with highs <50F. We've had two in April, and if the front had come through an hour earlier yesterday we would have had a midnight high then of 45F or something, which would have been three days <50F. Still waiting on the official number from NWS ABQ, they reported a picture of the snow earlier but no total.
-
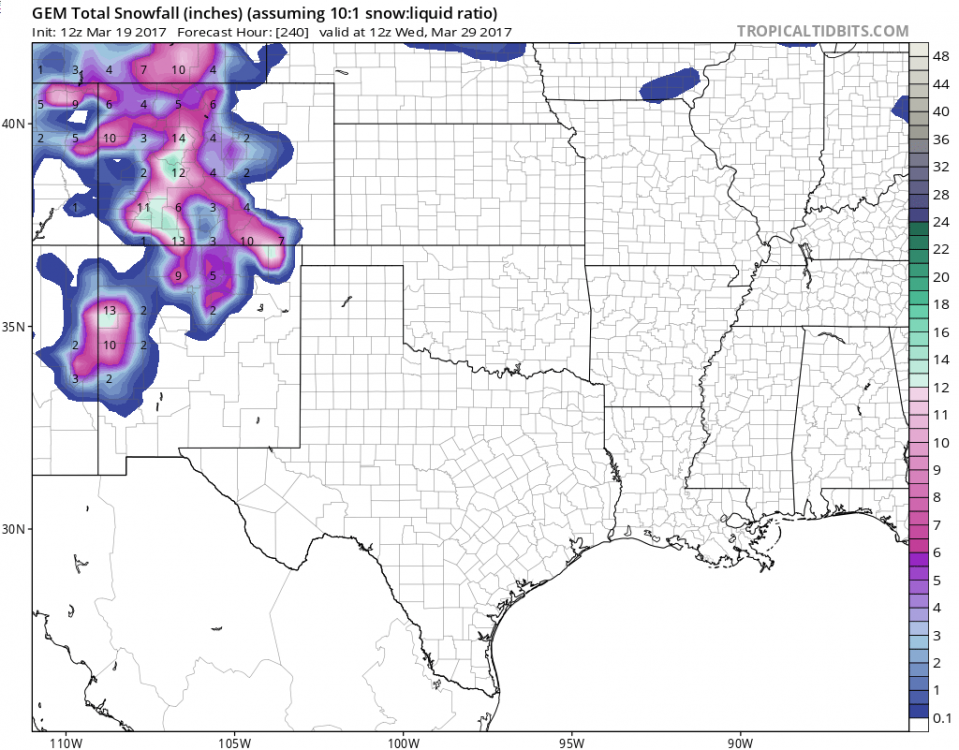
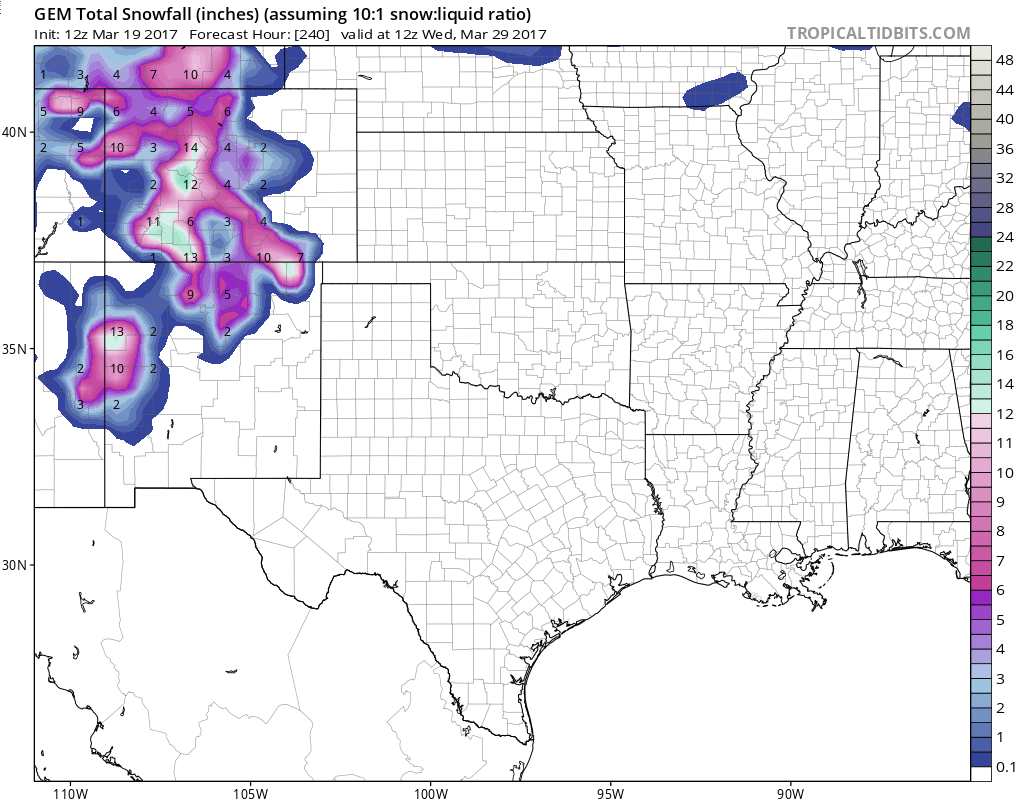
The 95th percentile from WPC has nearly 3 feet of snow in northern NM from this system, let's hope the forecast below doesn't "miss" low - a lot of people could suffer if the bust misses in the wrong direction. I'm expecting flurries-2" in Albuquerque, depending on how powerful the band is that moves over the city. Any intense precipitation should temporarily go over to snow and possibly accumulate on the ground.
-
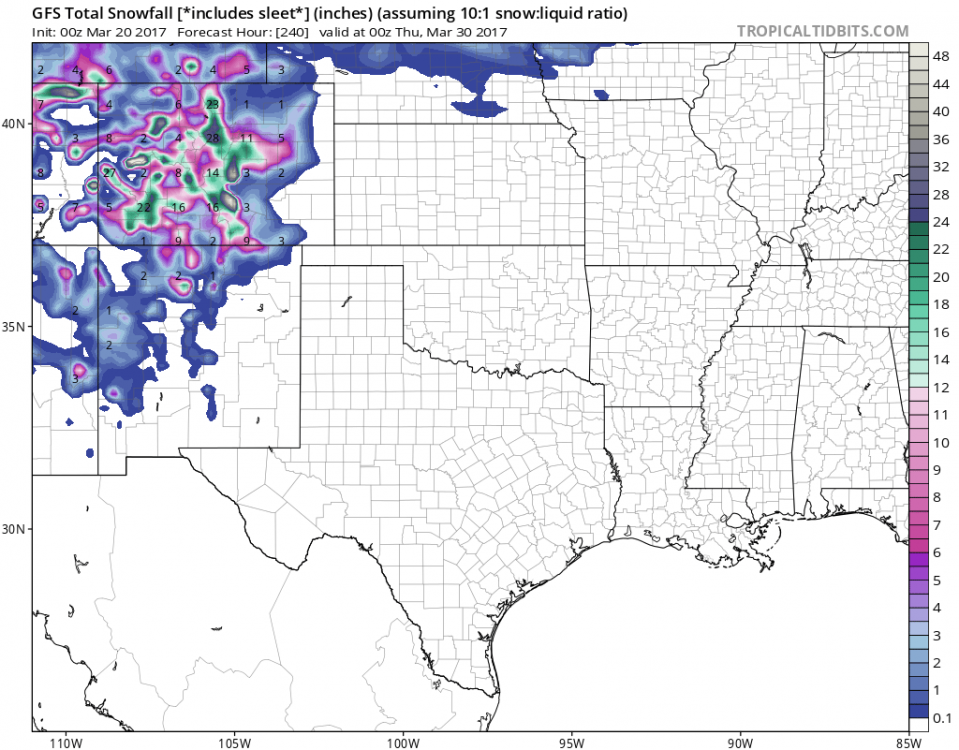
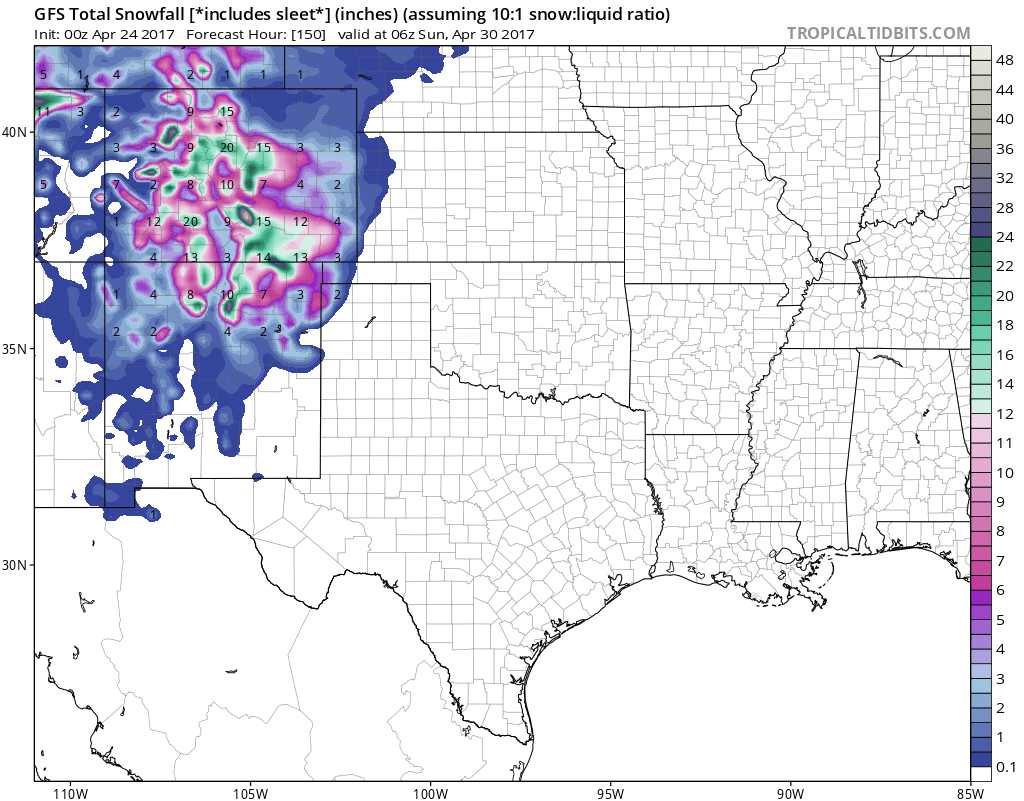
GFS on board with (probably) the final big-time snowstorm for the season in the SW. Will be nasty for severe weather elsewhere.

-
AMO (North Atlantic) fell to 0.175 - big time drop from February, also a bit below last March. Way down from June-Sept when it was 0.40 to 0.50. The Nov-Apr AMO value looks like it is the highest of this AMO+ cycle, barring another huge drop in April. The Nov-Apr value in 1952-53 was the last time the six months were above the current value. 1943-44, and 1944-45 were even warmer. I'd like to think the AMO/Atlantic will cool some next year, as we approach the flip year, and see an El Nino, but we'll have to see. I designed this "auto" analoging thing, and it thinks Nov-Apr 2016-2017 was closest to 1931-32, if you use Nino 3.4 (ONI in DJF), PDO (Nov-Apr), AMO (Nov-Apr), Solar (sunspots July-June), Modoki status in DJF, and previous year ONI in DJF. Tentative years closest to 2016-17 shown below. Close match on 3+ variables of the 7 counts as analog. The weighting is 3 = 1, 4 = 2, 5 = 3, 6 = 4, 7 = 5, essentially close variables minus two points. I divided Modoki into five categories, 2, 1, 0, -1, -2. The two means "warm center, but greatest anomaly to East", one means "warm center, and greatest anomaly in center", 0 means roughly same anomaly in both during Neutral year, -1 means "cool center, greatest anomaly in center", and -2 means "cool center, greatest anomaly in east". It was interesting to see the years below select mostly -1 and 2, as both are warm in the east relative to the middle (Modoki La Nina and East based El Ninos). ONI DJF PDO N-A AMO N-A Sun Jul-Jun Prior ONI Modoki Mons (In) 1931 -0.3 0.38 0.186 25.1 1.3 -1 3.54 1931 -0.3 0.38 0.186 25.1 1.3 -1 3.54 1941 1.1 0.70 0.247 76.5 1.9 2 5.44 1976 0.6 1.04 -0.315 23.2 -1.5 1 3.10 1983 -0.5 1.45 -0.085 82.7 2.2 -1 2.94 1983 -0.5 1.45 -0.085 82.7 2.2 -1 2.94 1998 -1.5 -0.45 0.154 115.2 2.2 -1 3.40 Mean -0.2 0.71 0.041 61.5 1.4 -0.3 3.56 2016 -0.4 0.93 0.258 28 2.2 -1 3.09
-
Albuquerque had it's greatest daily rainfall today in March since at least March 9th 2009, pending any more precip by midnight....a staggering 0.18"! Will be interesting seeing if the statewide snowpack numbers jump up a lot from 37% of normal today when the reading comes in 3.29. Historically, 3/29 is a good snowfall date for the state. Will be interesting to see if that verifies, a lot of the rain should go over to snow north and east of Albuquerque after midnight, even down to 5,000 or 6,000 feet.
-
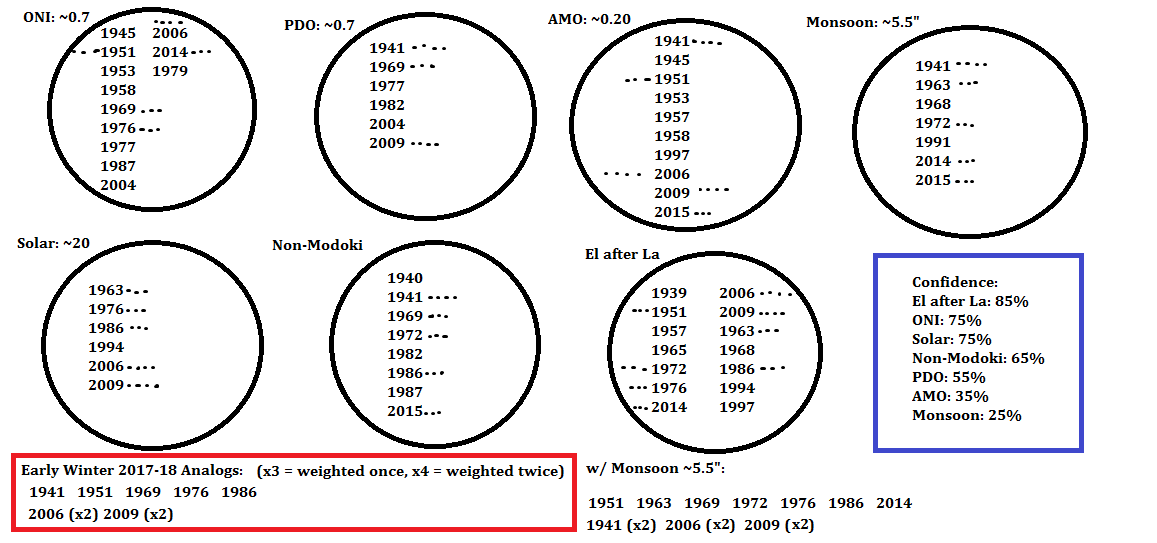
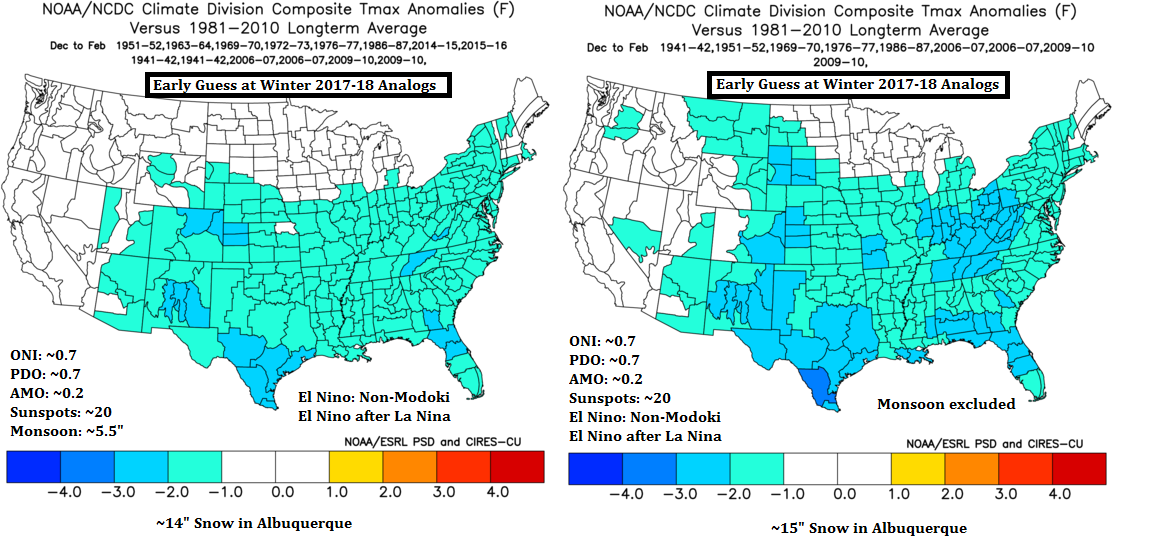
Very very early look at next winter looks pretty cold. Near-solar minimum El Ninos are much more likely to be cold in NM than higher-solar El Ninos. If you use 2F below the 85-year mean as the threshold for cold, it's 6/9 cold near the minimum, and 1/18 away from the minimum. Statistically significant difference in frequency of cold winters. I've kind of settled on these as the big seven for seasonal forecasting in NM: - AMO phase (<=-0.1, -0.1 to 0.1, >=0.1): WARM - PDO phase (<=-0.4, -0.4 to 0.4, >=0.4): WARM - ENSO (El Nino or not?). Neutrals will act like weak El Nino if Monsoon wet, like weak La Nina if Monsoon dry: EL NINO - Monsoon (>=4.3", or not): WET - ENSO order. El after El? El after N? El after La? La after El? La after N? La after L? N after El? N after N? N after L?: EL AFTER LA - Modoki? La Nina Modokis are often fairly wet in the West & warm in the east, as are east-based El Ninos: NON-MODOKI (look at Nino 1.2!) - Solar? 10x more likely to get big snow in March in high solar. Wetter Springs in high solar. Much colder in low solar El Nino though: LOW SOLAR (~2.5 yrs from min, ~20 sunspots) Looks pretty cold nationally too. Least confident about the AMO/Monsoon - monsoon is almost completely random other than a weak correlation to the PDO. AMO looks a lot colder than even two months ago.


-
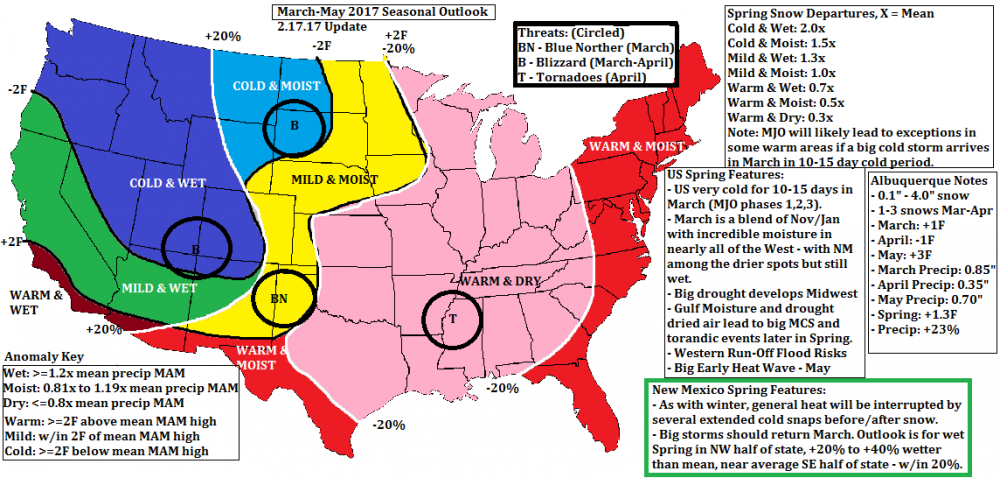
So...the legendary pattern may be returning for March? This is what the Canadian has. GFS still coming in... Going to be a lot of nasty tornadoes if the SW & NW are cool/cold with the SE warm.
-
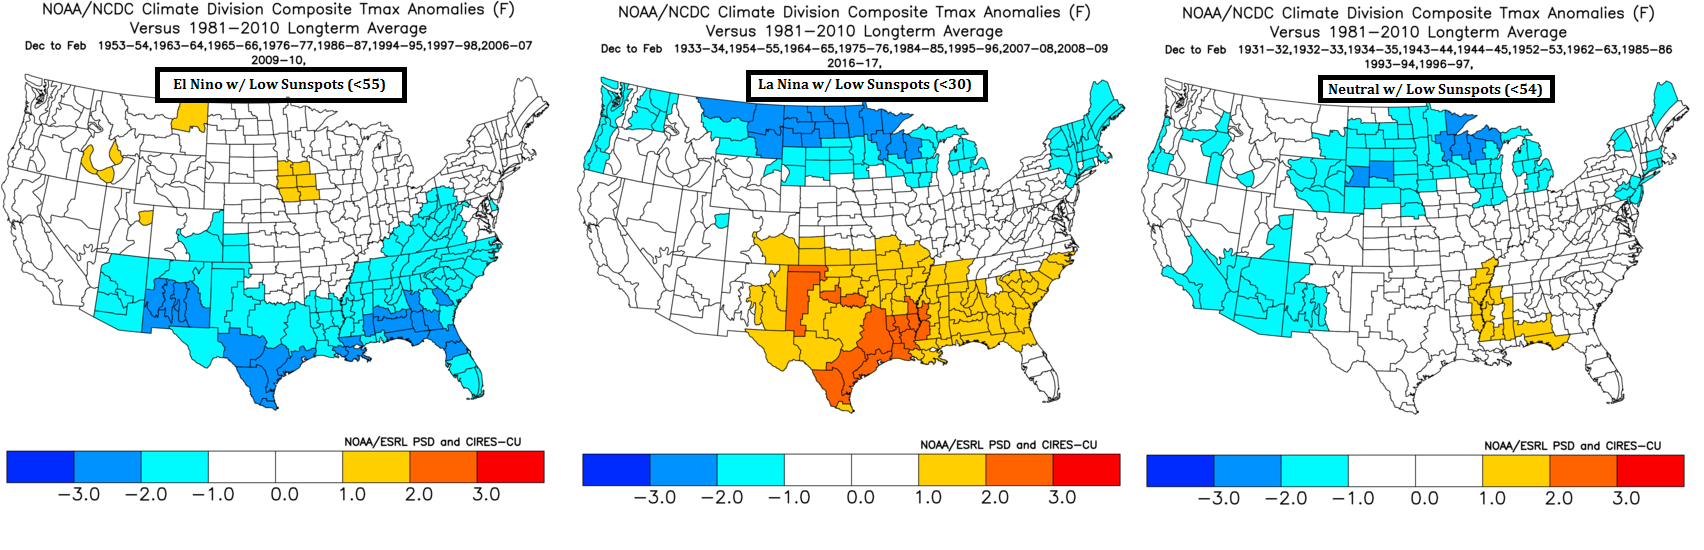
Well...that cool snap in the Atlantic is gone. The AMO & PDO hardly changed from Jan to Feb - 0.232 and 0.70 are the new numbers (ESRL and JISAO respectively). I've been playing with solar (sunspot) numbers lately since we're likely to be in near-minimum thresholds by 1749-2016 standards from the winter of 2016-17 to winter 2021-22. There don't seem to be a whole lot of huge impacts for my area, but it is notable that despite the reputation for cold in Solar Minimums, I found that here in the SW the minimum years (July-June years with monthly sunspot mean <=55), the real effect is El Nino / La Nina temperature differences are exaggerated. So the La Ninas are warmer at the minimum, and the El Ninos are colder at the minimum. La Nina at the solar minimum is also the worst snow pattern historically for Albuquerque, but its offset by El Nino at the solar minimum, which is the coldest pattern for Albuquerque. Expecting two of the six winters from 2016-17 to 2021-22 to be cold (mean high <=47.5F) with one possibly <=46.5F. Overall, when I did a proportion test (http://www.socscistatistics.com/tests/ztest/Default2.aspx) I found the following held true at the P<=0.05 level: - Odds of >=8" snow in a month is much more likely near solar minimum (18% v. 9%) - Odds of >=2" snow in a month is less likely near solar minimum (81% v. 96%). - Odds of winter being 2F or more below normal mean highs are 3.5x greater near solar minimum than in other years (33% v. 9%). - Odds of >=3" snow in March fall massively during near-minimum years (3%) v. all years (28%). It is the only month from Nov-Apr to show this effect. P was 0.00398, super low. - Precipitation, odds of snow, and Fall/Spring temperatures were not impacted at the P<=0.05 level, although I didn't check snow frequency of precip frequency, just totals. Spring / Fall temps I think might be impacted if I centered solar years on March / Sept instead of Dec, but i haven't looked at that yet. Spatially, it is interesting to note that El Nino with solar minimum is very cold in NM, while El Nino with solar maximum is very cold on the East Coast. The Midwest freezes when you have Neutral with near-normal solar.

-
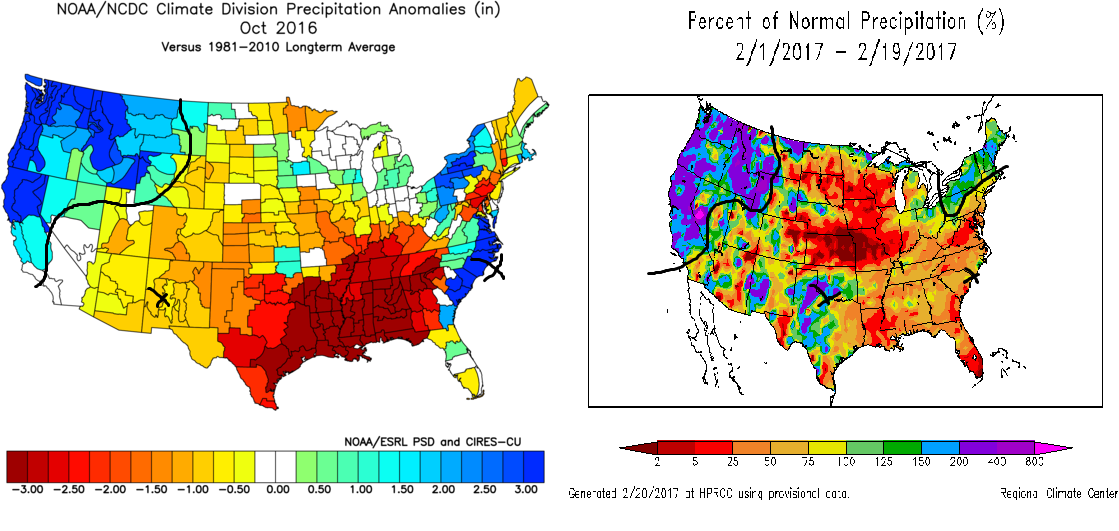
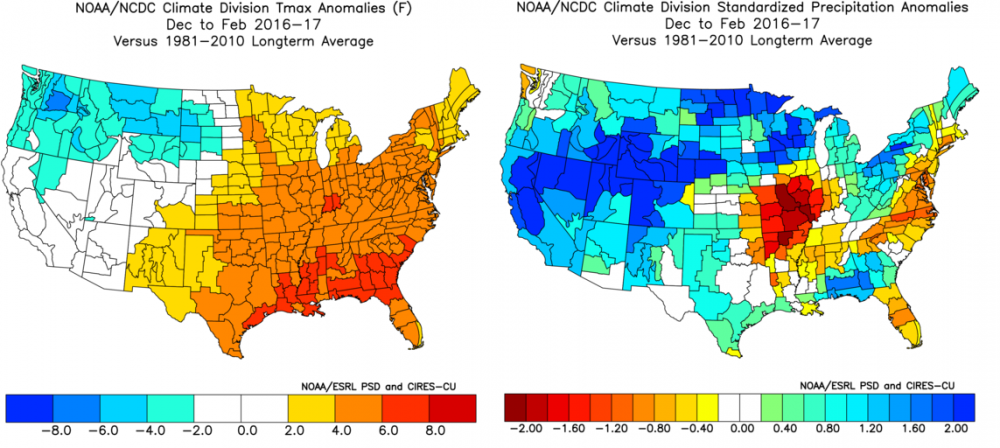
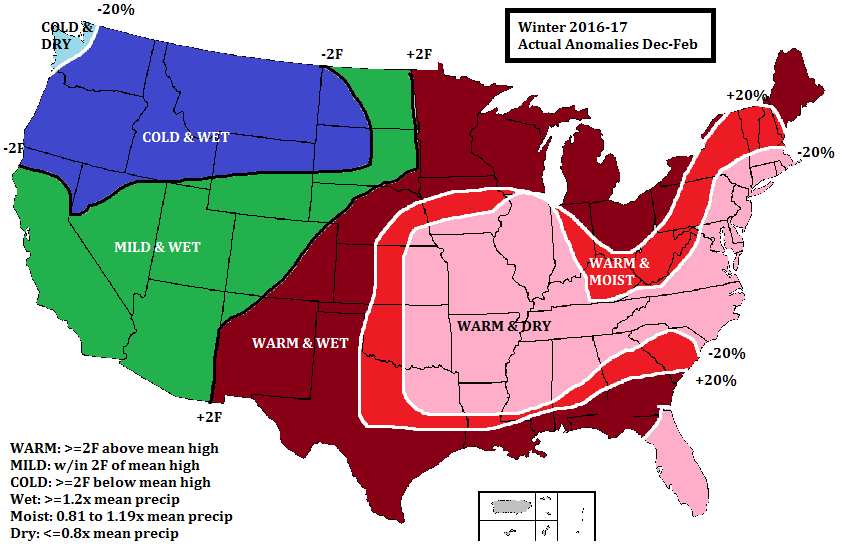
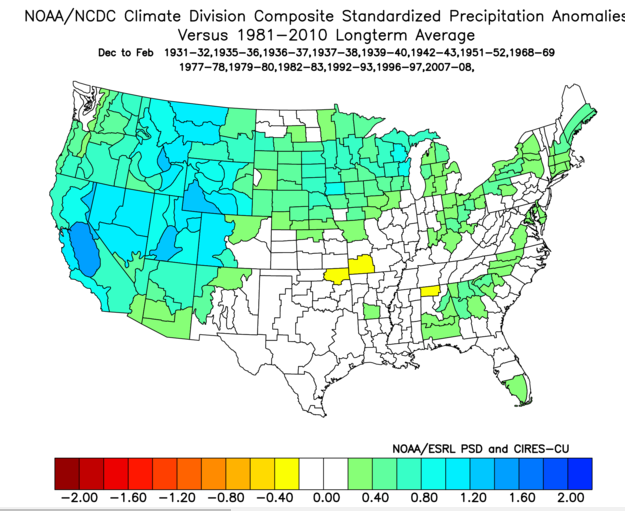
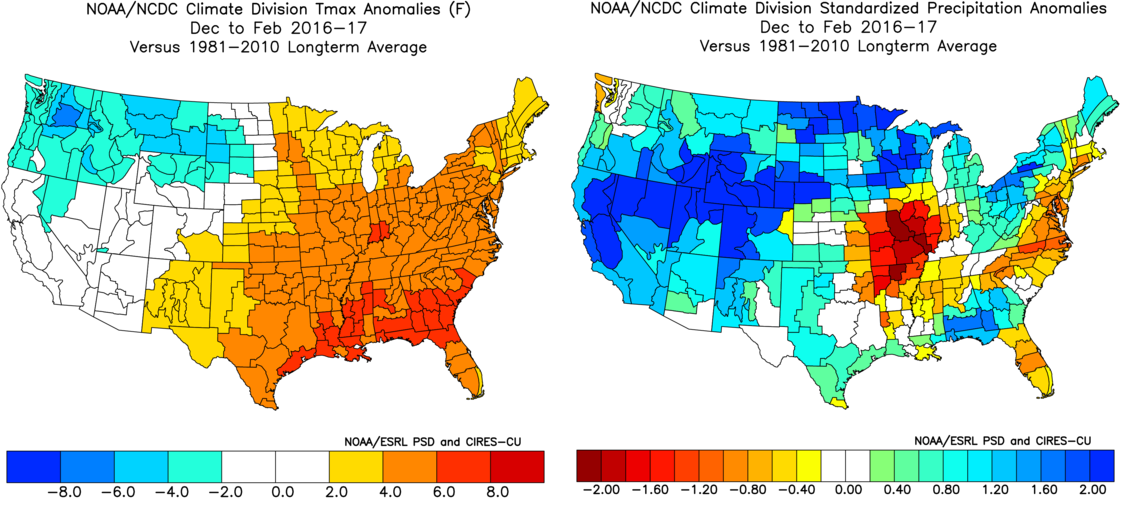
Here is a look at the final temperature anomalies for the winter. Ridiculously wet for just about all the West, which is a fairly rare outcome - first time since 2007-08. Very warm winter in much of the Southeast. Very cold, likely near record cold, in parts of Washington state. My October forecast idea wasn't terrible, had the West very wet, and the east dry/warm. The dry/warm area got further West and was stronger than I thought, so it pushed the cold/wet area back some to the West. This is mainly because the PDO has stayed positive instead of hanging out around 0 like I thought it would. The entire West being Wet in a winter has only happened ~15 times since 1930, so kind of cool to see that happen again.
-
Fun pictures. Snow in Texas in March have been quite the shock for some people. We had 9.6" Feb 26-28 that winter, biggest non-Dec snowstorm in Albuquerque in 30 years. One of the features of the 2014-15 Winter / Spring was the Atlantic actually got to the cold side of "average" in Feb-Apr. AMO ended up at 0.005 or something for Nov-Apr in 2014-15. It's interesting to see it radically cooling off again in the East again.

-
Central/Western Medium-Long Range Discussion
raindancewx replied to andyhb's topic in Central/Western States
I haven't looked at the impacts in other areas, but the July-June year looks like it is going to average ~29 sunspots per month for 2016-17. We're likely in the first of six low solar years. Here in Albuquerque, we're four times more likely (34% v. 9%) to get a winter with mean highs 2F or more below average when July-June sunspots are below 55 annually. The last era for similar activity was 2005-06 to 2010-11. Right on schedule..with 2016-17 as the first "low sunspot" year. The last min was 2008-09 (centered right around Jan 1 2009), so presumably the next min in 2019-20. Expecting two of the next five winters to be 2F or more below the long term mean high which is 49.5F. When our mean high is <=47.5F here (-2F), we have about a 60% higher than usual shot at seeing more snow than average from Oct-May. -
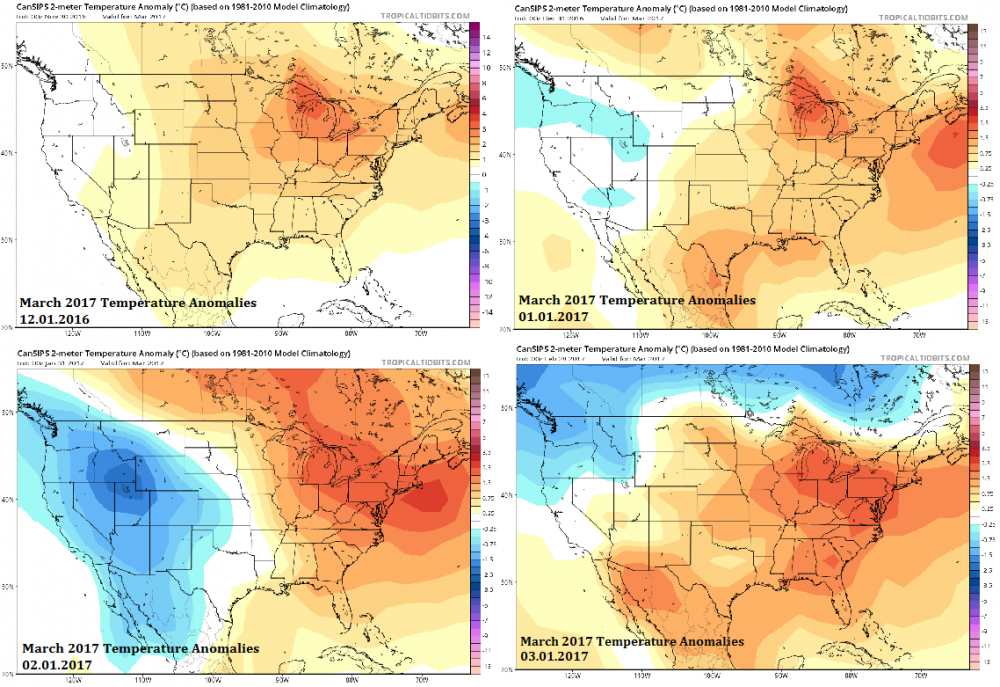
The Canadian Model just came in with its new monthly outlooks. It likes April to be very cold in much of the West now, colder than the last forecast. The country trended warmer for March. New Mexico does look a bit wetter than before for March but still a bit dry. Bit disappointing to see the trend toward cold in the West for March vanish.
.thumb.png.8cd8cf8baa6258d556b67ba151e1c9e1.png)
.thumb.png.8b59be54b8729b2a1ca0049487ef589c.png)
-
Ski resorts did pretty well with the storm that came through overnight/today in NM. Taos got 16", and most of the other resorts in the north got 5-10". Now that it March, going to be interesting to see if it rains or snows in the city in March for the first time in two years!
-
AMO (ESRL) fell to 0.233 in January, from 0.343 in December using this index - https://www.esrl.noaa.gov/psd/data/correlation/amon.us.long.data
-
One of the things about this winter that is overlooked for the West is that Nino 1.2 was a borderline El Nino all winter - the Nino 1.2 monthlies never dropped below +0.25C or so in July-Jan during the La Nina. I wasn't quite sure how to weight it in my winter outlook, but Nino 1.2 in some ways is the real mechanism for California. In the El Nino in 2014-15/2015-16, Nino 1.2 never really topped 3.4 - which is not a particularly wet signal for CA. For this year, Nino 1.2 was around 1C above Nino 3.4 the entire winter, functioning like a bizzaro-east based El Nino in practice, and as we all know, East based El Nino years are warm in the eastern two thirds of the US.
-
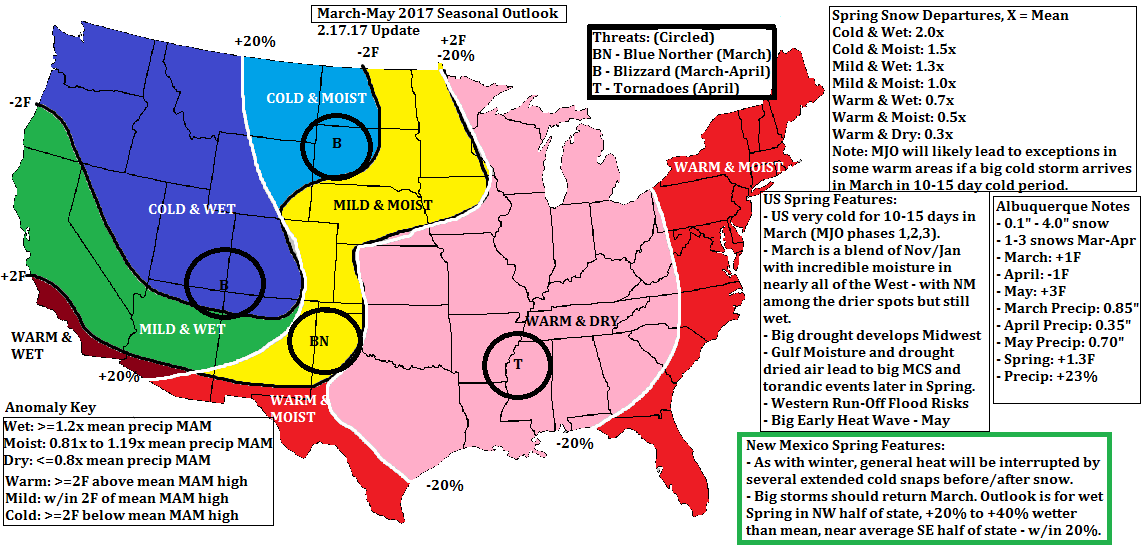
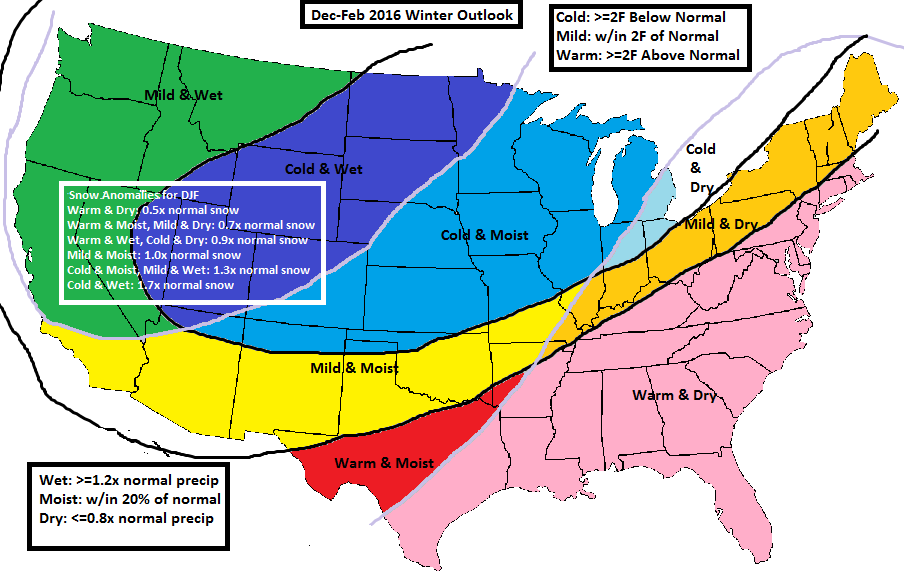
This is my updated Spring Outlook for anyone curious. Have much of the Midwest & TX dry, with heat generalized east of the Rockies. Expecting one-two wetter months in NM given the persistence of storms since November.
-
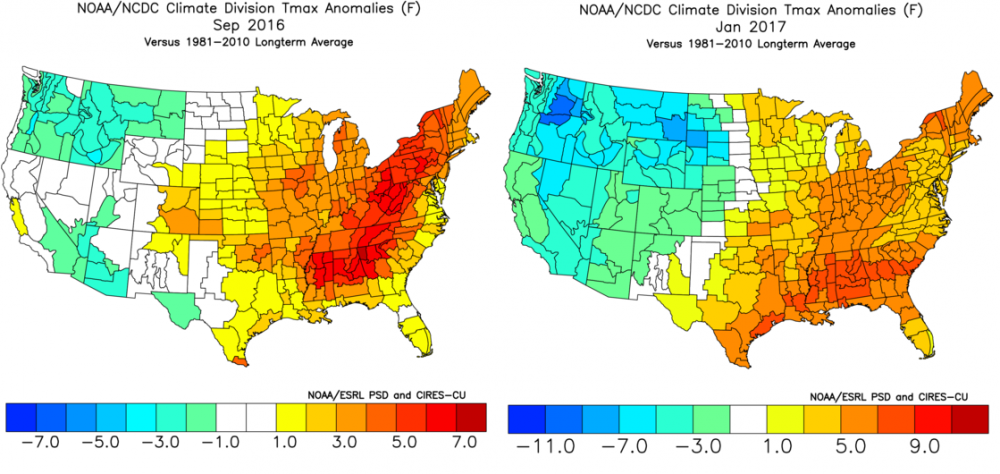
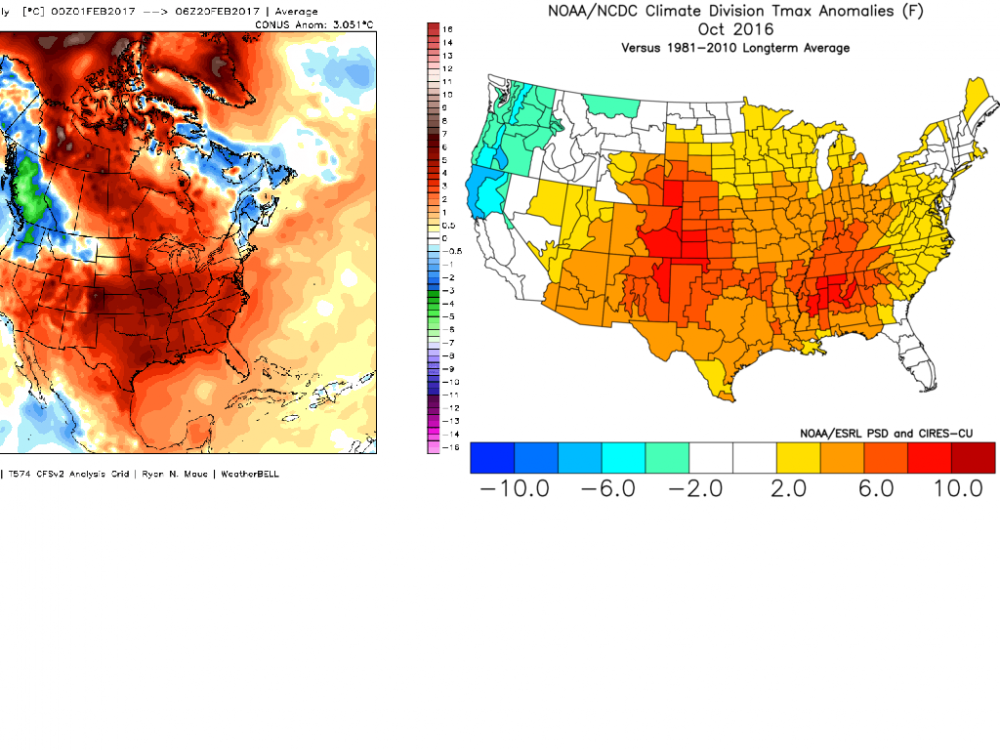
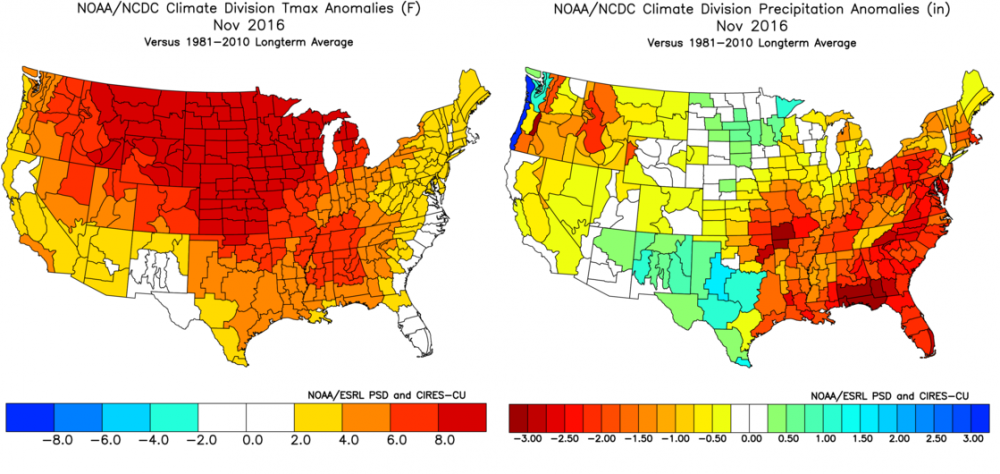
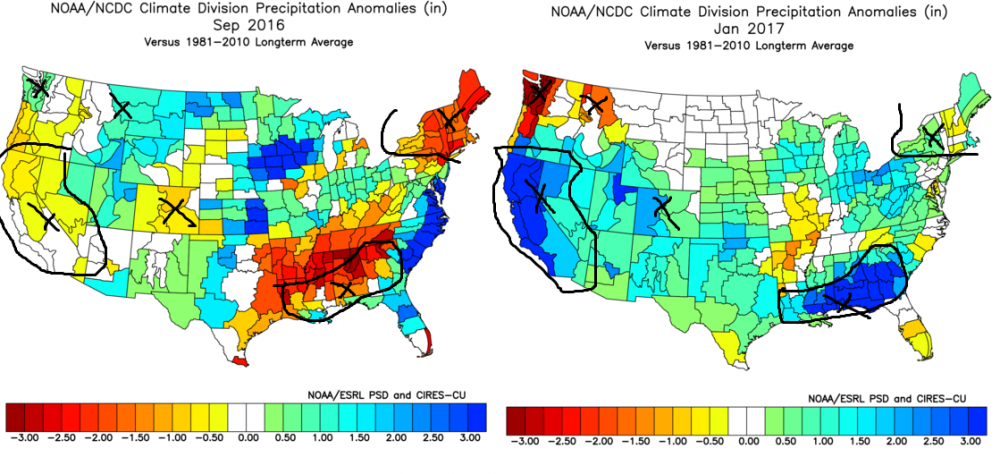
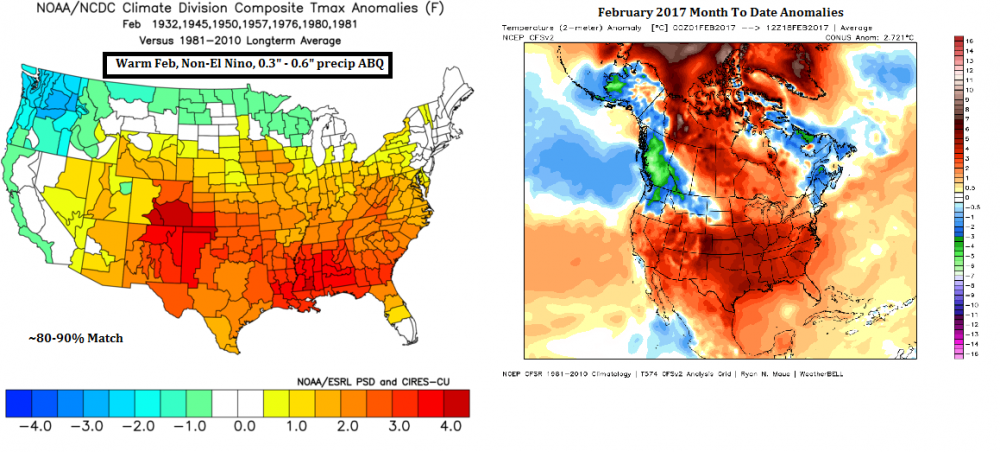
Can't help but notice that the temperature pattern for February is basically a matching image of October. Going to be a wild March if March is a spitting image of November. Especially since September is basically a matching image of January. February precipitation is also a strong match to October, although Sept/Jan are not strong for precipitation. Should also note that Dec/Aug are not a good linkup at all either, even worse than Sept/Jan for precip, and terrible for temps. But there are decent temp link ups for Sept-Jan, Oct-Feb, so it does make you wonder about March.

-
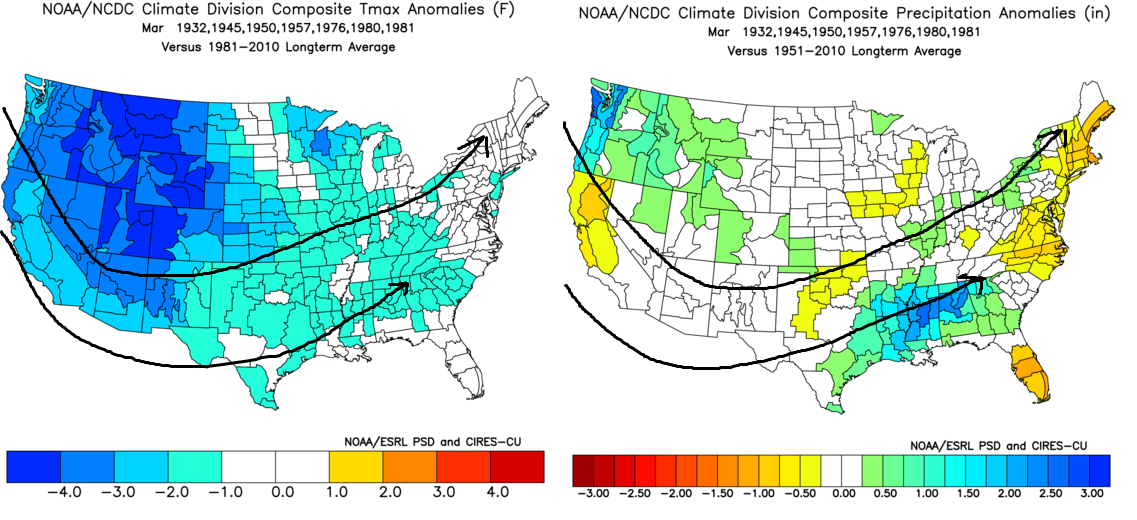
Warm Februaries in non-El Nino years with 0.3" - 0.6" precipitation in ABQ tend to be followed by "cold" (for March) and stormy Marches. These years were good matches in January too, although terrible in Nov/Dec. Suspect the strength of the match will fade some in March and vanish by April? To me the March maps looks like a blend of MJO 7/8/1/2/3, so maybe we start out in 1/2/3 but make it back to 4-7 at the end of the month to warm the East up?

-
Central/Western Medium-Long Range Discussion
raindancewx replied to andyhb's topic in Central/Western States
JAMSTEC has increased it's forecast strength - and imminence of the coming El Nino. Says it is here in April. Last year, its forecast for La Nina peak strength did well - had it getting to -0.7C around this time last year.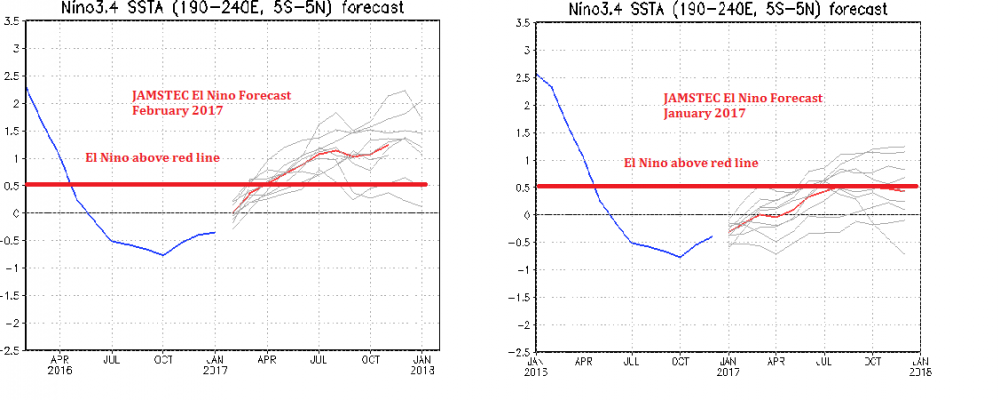
-
As a sanity test, I did a bunch of quick statistical tests to see which months, filtered by ENSO state - L/N/E - are most predictive of a wet or dry March here. For La Nina, the best two are Aug+Oct as a unit, and January. We had a very wet January here, and an OK Aug+Oct for precip. When I ran the numbers, 1973-74 popped up as almost identical to 2016-17 - huge January, nearly the same numbers in August & October. Despite the differences in the AMO, the MJO timing seems similar. La Jul-Jun Jan Aug + Oct March Formula Error Err, All Avg 1933 0.06 2.66 0.01 0.50 0.49 0.35 1938 0.70 0.80 0.67 0.60 0.07 0.31 1942 0.25 2.15 0.23 0.35 0.12 0.13 1949 0.02 0.86 0.04 -0.11 0.15 0.32 1950 0.41 0.09 0.29 0.18 0.11 0.07 1954 0.29 0.90 0.00 0.13 0.13 0.36 1955 0.46 1.38 0.00 0.33 0.33 0.36 1956 0.78 0.96 0.52 0.68 0.16 0.16 1964 0.47 1.02 0.49 0.32 0.17 0.13 1970 0.27 2.49 0.03 0.42 0.39 0.33 1971 0.12 2.02 0.08 0.29 0.21 0.28 1973 0.88 1.54 0.85 0.71 0.14 0.49 1974 0.26 2.75 0.95 0.48 0.47 0.59 1975 0.00 1.40 0.09 0.06 0.03 0.27 1983 0.33 1.47 0.62 0.25 0.37 0.26 1984 0.49 5.74 0.70 0.79 0.09 0.34 1988 0.57 3.61 0.48 0.49 0.01 0.12 1995 0.17 0.74 0.02 -0.02 0.04 0.34 1998 0.12 2.68 1.10 0.49 0.61 0.74 1999 0.30 3.30 1.27 0.58 0.69 0.91 2000 0.28 3.23 0.27 0.58 0.31 0.09 2005 0.04 1.52 0.14 0.12 0.02 0.22 2007 0.39 1.22 0.00 0.26 0.26 0.36 2008 0.00 2.42 0.31 0.43 0.12 0.05 2010 0.07 1.21 0.00 0.03 0.03 0.36 2011 0.40 2.41 0.20 0.41 0.21 0.16 2016 1.04 1.60 0.87 0.87 0.36 I was pleased to see it, 1973-74 was one of my analogs for the winter. The precip anomaly map today looks like 1973-74 but upside down - i.e. it's a warm AMO/PDO version of 1973-74 instead of the cold AMO/PDO version. The super heat is still in the SE though. Just for kicks, I tested what predicts March precipitation in a Neutral too. It's July, November & February. Using Neutrals, 1981-82 and 1996-97 are probably the best matches (which is interesting - given that they went into huge El Ninos fairly early). 1997 had a snowy, very wet and very cold April here, but 1982 was wet in March. 1981-82 was another analog I had for winter here. The Neutral predictors say we get 0.23", instead of 0.87", but in an ONI sense I'd bet on the La Nina number being closer given the La Nina conditions from July to January. Anyway, it's interesting looking at this because the months that are predictive for March moisture in El Nino implied a dry March last year, which verified, but this year, the numbers imply 0.87" precipitation in March, which would be our biggest March total since 2005. I'm cautiously optimistic that we kill the nine-year drier than average March streak this year.
-
Albuquerque (officially) got 1.1" snow at the airport on 2.12.17 after being 75F on Friday. Maybe another 0.2" to 0.5" midnight after, but no report yet. It's winding down for now, but should snow again tonight. I think I only got 0.5" or so, but generally seems to have been 1-3" to the South & West, with a coating to two in the north and east. We've already matched January, our prior "high" month for this snow season. Kind of nice to see. My analogs and some tests I've developed suggested February was most likely to be the snowiest month based on Summer observations. Looks fairly likely now, unless March comes through. Pretty rare to get an over 1.1 inches of snow in April here (14% of Aprils in 85 years). So...our snowiest month will probably be February, March, or a Jan-Feb tie I guess if none of the snow that's fallen since midnight added up to over 0.1". Snow pack state wide fell from 139% of normal (Jan 25) to 91% of normal (Feb 12). Hopefully we can recover a bit before it all starts to rapidly vanish in mid-April.
-
I'm starting to get excited for March - the European weeklies if anything keep getting colder for much of the West. The CFS seems to be slowly trending in that direction too, and Canadian has been trending colder in its monthly outlooks since December. The deeper the European weeklies get into March, the greater the precipitation anomaly forecast. The ensemble mean and control run show a ton of snow falling in the SW & CA over the next 45 days too. If the temperature pattern verifies, cold West, very warm SE, the area in between is going to have to deal with a lot of nasty tornadoes in late Feb & March.
-
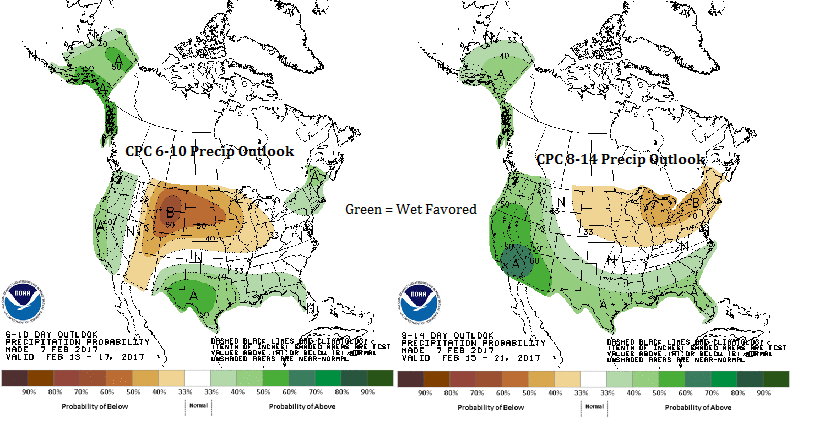
Sad thing is our snow pack was at 139% of normal statewide on Jan 25, 13 days later, it's 113% of normal state wide. Been losing 2% a day on where we should be with the lack of snow and gradual warmth. Good news is this system coming in over the weekend looks pretty strong and snowy. European has two inches for Albuquerque. The CFS monthly, European weeklies, and Canadian monthly all show a fairly cold March for much of the West, and CPC has wet conditions for 2/13 to 2/17, 2/15 to 2/21, and 2/18 to 3/3 for New Mexico. Albuquerque has been drier than the long-term March average every year since 2007, would love to see the dry-streak break this year. The MJO is also about to go through phase eight with near record magnitude since 1975. The years where the MJO goes nuts in Feb/Mar tend to have big snow storms out here if it gets to 8-1-2-3. I think Jan-Mar 1988 is the best match to what has happened recently and what is forecast since 1975, but we'll have to see. Would really like to see the wave move intensely into 1-2-3 again, got super cold here in late January when it did that before, but too early to know if that is in the cards or not. We haven't had a cold March in a non-El Nino here (ABQ) since 1975, so I'm a bit suspicious of that part of it, but we keep getting these 25 day dry spells followed by a ~ 20 days where it is very wet for three weeks, with four to five storms, with some trend towards a wet week with one-two big storms instead in a week more recently. Dry Spells: July 3 - July 28 Aug 21 - Sept 10 Oct 10 - Nov 1 Nov 22 - Dec 16 Dec 24 - Jan 13 Jan 22 - Feb 12/13? Mar 8 - Apr 1? Apr 24 - May 17? Wet: July 29 - Aug 19 Sept 11 - Oct 9 Nov 1 - Nov 21 (Dec 17-23) (Jan 14-21) Feb 13 - Mar 7? Apr 2 - Apr 23? May 18 - Jun 8?


.png.da3de20ffb212ce399556dd50ba0c990.png)
.png.4c0d304fb56f0db56fd12d738ddd81fb.png)