

raindancewx
-
Posts
3,847 -
Joined
-
Last visited
Content Type
Profiles
Blogs
Forums
American Weather
Media Demo
Store
Gallery
Everything posted by raindancewx
-
2021-2022 ENSO
raindancewx replied to StormchaserChuck!'s topic in Weather Forecasting and Discussion
For comparison: The 'weak' 2017-18 La Nina...and whatever this is. You do have to add the -0.5 to +0.5 zone as white for a true comparison, but still, no meaningful warmth mid November 2017 in 120-170W. -
2021-2022 ENSO
raindancewx replied to StormchaserChuck!'s topic in Weather Forecasting and Discussion
All the coldest waters are now east of Nino 3.4, the 120-170W zone. Warmth is already almost to 140W.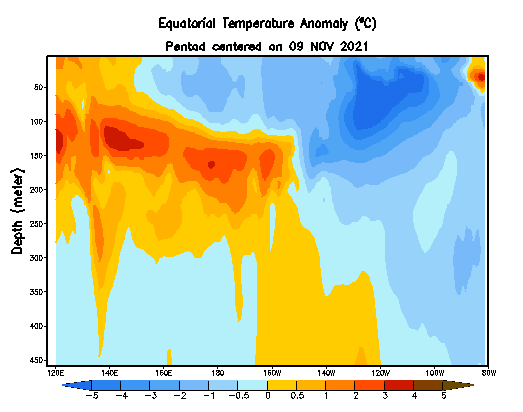
-
2021-2022 ENSO
raindancewx replied to StormchaserChuck!'s topic in Weather Forecasting and Discussion
From Nate Mantua today - first monthly reading under -2.0 since September 2012. 2021 PDO Index monthly values: January -0.16 February -0.54 March -1.17 April -0.91 May -0.94 June -1.18 July -1.87 August -1.12 September -1.53 October -2.55 -
2021-2022 ENSO
raindancewx replied to StormchaserChuck!'s topic in Weather Forecasting and Discussion
The rapidity of the subsurface warming this month will be a good hint on how December and the rest of winter play out. 1983, 1984, 2011 all had a substantial weakening of the subsurface from October to November. Year Oct Nov 1983: -2.25 -1.81 1984: -0.96 -0.63 2011: -1.26 -0.92 Blend: -1.49 -1.12 2021: -1.61 ???? Too early to generate a close match on the subsurface warming, but this is what you get from those three La Nina years with a lot of subsurface warming October to November: When I say substantial, I mean a 0.3 or greater warm up from a cold October subsurface for the top 300m of the 100-180W zone. https://www.cpc.ncep.noaa.gov/products/analysis_monitoring/ocean/index/heat_content_index.txt That three year look is actually pretty close (albeit exaggerated warm and cold) to what I forecast for December. -
It's interesting how the train of storms dumping into the West in January 2021 preceded the severe cold in February 2022 in the Plains, and then this year, we had the train of storms into the West ("atmospheric river" hype) and now it's a pretty cold start - at least - to November. Off the top of my head, the cold SE half of the US v. warm NW half of the US looks for 11/1-11/10 are something like ~12 years at most since 1950. It's not super common in that time frame. Opposites are rare too. 1953, 1954, 1955, 1958, 1962, 1997, 2006, 2014 1967, 1976, 2007, 2010 arguably too. 2003 is a near perfect opposite. Anti 2003-04 (x2), plus 1954-55 (x2), 1955-56 (x2), 1962-63 (x2), 1967-68, 2007-08, 2010-11 is fairly similar to what I forecast in October. It's my typical scale, white is -1 to +1 in F, then each new color is a 2 degree Fahrenheit range against long-term average. The -PDO is correlated to cold in SW Canada, and the -WPO is correlated to cold in SE Canada for winter, but there is overlap where both favor cold in South-Central Canada. So it's interesting to see that show up below. Edit: Whoops, forgot 2010-11.
-
More than the dryness, I hate how boring La Ninas are. I'm relatively optimistic that these giant lows / 'atmospheric river' events will eventually translate further south around the Christmas to mid-February time frame and that we'll see some rain/snow pretty deep into the Southwest. Fall has actually annoyed me too. The analogs I had showed several hurricanes hitting Mexico, but the WPO / trof positioning was in the right phase to not shunt the moisture to Texas like we had several times this year. All that moisture went to waste.
-
Some Thoughts on the Winter 2021-22 Outlook
raindancewx replied to OHweather's topic in Weather Forecasting and Discussion
My favorite assessment of the Weather Works outlook. -
2021-2022 ENSO
raindancewx replied to StormchaserChuck!'s topic in Weather Forecasting and Discussion
When I did my outlook, I found that the rising solar years that were cold ENSO winters often failed as La Ninas in the actual winter, despite the tendency for many of the years to be quite cold briefly early or late. Rising solar + cold ENSO: 1955 & 2010 are pretty strong La Ninas and relatively well behaved 1946, 1947, 1948, 1956, 1966, 1967, 1996, 2000, 2011, 2012 are all cold, and near La Ninas at least at times, to fairly healthy events - but they all have some weird properties too. We seem to have at least some of the properties of the second group. A lot of severely cold Decembers in the East don't have H1 November cold in the East (think 2000 - when it was cold West). Will be interesting to see how the second part of this month shakes out. -
The local NWS was talking about the "convection near 10N/110W" today...and when I looked I saw it and got excited. But then I remembered it's a tropical depression / remnant low. Don't really agree that this is a moderate La Nina either. It's pretty weak, and the warmth below the surface is already pushing into western Nino 3.4. I did have a big pattern shift in my winter outlook for mid-November, and I do agree a pretty big change is likely in the 11/15-11/20 time frame. Conceptually, we've had good rains and good cold shots here every 46 days for the 9/30-->8/15-->7/1 ish time frame, works into May too. So next shot is ~11/16 ish. When I see good rains, I mean 0.10"+ at each 46 day interval. I had modeled November after August - and August started with a hot West / cold East look, similar to what we've seen this month. Will be curious how if the later August look, which got pretty cold in the Northwest actually verifies. CPC certainly has that. The high and dry weather continues through next weekend but there are signs of major changes toward the middle of next week. The anomalous deep convection near 10N and 110W is a very good sign (drawing the storm track southward) not just for next week but for the winter in general. November climate models runs are out and they are more encouraging with regard to precipitation for DJF given a negative PDO and moderate La Nina. A comprehensive winter outlook will be released via social media and on weather.gov/abq later this week.
-
-WPO Novembers in La Nina are kind of a mixed bag for December, but a lot of them do get pretty cold nationally, even in the South. I'm a bit annoyed the WPO has gone negative this month, my analogs didn't have that at all, but they did show it going neutral/negative in December. The closest -WPO La Nina November similar to what the Canadian forecast in the US this month for temperatures is probably November 1954, followed in distant second/third by 2005 and 2007. As a blend, that'd be an interesting December, and it's relatively consistent with what I had for December if you assume it'd be a bit warmer everywhere with that three year blend centered on ~1988. My gut for a while has been December wouldn't be super cold nationally, but mostly because it would be quite cold late November into mid-December, before reversing between 12/15 and 12/25 to warmer conditions. I assumed November would follow the August temperature progression nationally, with a cold East / hot West look to start, and then a big breakdown mid-month to a different look. We'll see how that goes, but the cold East / hot West start, like August, is certainly correct. Several of my analogs were pretty cold in the East for the end of November, but I also blended in a couple warm years to de-fang the severity of it.
-
https://xmacis.rcc-acis.org/ That's where the data is. It's pretty poorly maintained for a lot of sites, but it's generally very good for the airports and other major spots.
-
2021-2022 ENSO
raindancewx replied to StormchaserChuck!'s topic in Weather Forecasting and Discussion
I'm not sure what's up with the weekly data v. Tropical Tidbits, but the TT eastern zone warming does not show up below. On the weekly data, we remain warmer across the board than last year. Subsurface continues to see cold and warmth moving east "up" so to speak. This site is so infuriating with pictures - these links do no copy pictures correctly sometimes, and other times they do. https://ibb.co/F4wZwj8 Nino1+2 Nino3 Nino34 Nino4 Week SST SSTA SST SSTA SST SSTA SST SSTA 29SEP2021 21.2 0.5 24.9-0.1 26.3-0.4 28.0-0.6 06OCT2021 21.0 0.2 24.7-0.3 26.1-0.6 28.0-0.7 13OCT2021 20.7-0.2 24.4-0.7 26.0-0.8 28.1-0.5 20OCT2021 20.3-0.7 24.2-0.8 25.9-0.8 28.1-0.6 27OCT2021 20.6-0.6 24.1-0.9 25.6-1.1 28.2-0.5 03NOV2021 20.6-0.8 24.4-0.7 25.8-1.0 28.0-0.7 30SEP2020 20.0-0.8 24.4-0.6 26.0-0.7 27.9-0.7 07OCT2020 20.1-0.7 24.1-0.9 25.8-0.9 27.9-0.7 14OCT2020 20.5-0.4 24.1-0.9 25.6-1.1 27.8-0.8 21OCT2020 20.5-0.6 24.2-0.9 25.5-1.3 27.8-0.8 28OCT2020 20.3-0.9 23.8-1.3 25.0-1.7 28.0-0.7 04NOV2020 20.5-0.9 24.0-1.1 25.3-1.5 27.9-0.8 -
Winter 2021-2022 Outlook
raindancewx replied to 40/70 Benchmark's topic in Weather Forecasting and Discussion
It's amusing to see you come up with what I have, a month later, but with far more years used so the signal gets dulled out to almost nothing. You do have December different it looks like, but you've got Jan, Feb, almost identical to me, as well as the overall DJF look almost identical, just dulled out. Last year, you and Isotherm and Griteater all had similar looks to me, but with a very warm February swapped for the cold I had in the Plains....which was...eh. -
2021-2022 ENSO
raindancewx replied to StormchaserChuck!'s topic in Weather Forecasting and Discussion
Last year's La Nina was fairly similar to 1954-55 in some ways, with an early peak, low solar, following an El Nino, etc. 2019-20 and even 2018-19 were a bit like 1953-54. https://www.psl.noaa.gov/data/correlation/nina34.data It's not really that surprising that we have some characteristics of 1955-56. I've been avoiding that year as an analog because it's a ridiculously strong La Nina in the Fall (24.25C in Nino 3.4! That's -2.25C, comparable to 1997 in the opposite direction). I'd imagine the subsurface reading in that event was -3 or -4 given how cold it got. You can see some of the similarities though - the big weird super +WPO, super -NAO look is there in October 1955 like in October 2021. October WPO NAO 1955 +1.20 -1.47 2021 +1.74 -2.29 -
2021-2022 ENSO
raindancewx replied to StormchaserChuck!'s topic in Weather Forecasting and Discussion
Yup. I've done research on the PDO. When it's over +1 or below -1 on the Mantua calculation you go against it at your own peril. The 2017-18 to 2020-21 Nov-Apr periods were all in the -1 to +1 range, where it is much less important. The record cold/snow in late 2014-15 was with the most positive PDO ever. I should be clear though, the correlations are strongest for the PDO roughly 1/20-3/10. In any case, the new Euro has a much weaker La Nina than at this time last year. My forecast had a La Nina peak around 25.5-25.75 in Nov-Dec that reversed to 25.75-26.00C for Dec-Feb. That still looks right to me. The November peak last year was 25.28C, and years like 2010 were already at 25.0C in November. -
2021-2022 ENSO
raindancewx replied to StormchaserChuck!'s topic in Weather Forecasting and Discussion
Some of the attempts at reconstructing El Ninos / La Ninas imply that long-term, pre-1700/1800s, La Ninas were more common by quite a bit. Right now, I think it's 40/40/20 between La Nina / El Nino and Neutral. CPC uses a sliding scale where every few years a La Nina initiates against a warmer base state, i.e. (26.5C) + (rate of warming x years) - 0.5C = La Nina To me, if the tropics are warming, it's real simple, La Ninas are becoming weaker and less common over time. The way things are going CPC will call 26.5C events in winter in Nino 3.4 La Ninas in 50 years. The issue of course is the surface may be warming, but the oceans are deeper than Mount Everest in places, and once you get below 1,000 meters or so, the water is just above freezing basically everywhere. As long as the currents can pull up the very deep water, the slow warming on the surface doesn't really matter for the ENSO cycle. -
2021-2022 ENSO
raindancewx replied to StormchaserChuck!'s topic in Weather Forecasting and Discussion
You can see the coldest blotch of waters is actually moving pretty quickly to the east now. 140W and -100m on 9/25 for the center. Then 130W and -80m on 10/31 for the center. There is a lot of warmth coming that will drain into Western Nino 4 too. -
This is for Denver for 1931-2021, July-Oct. Impressive that you're actually running much drier than Albuquerque. We've had over 3 inches of rain in that time frame. When I ran snow totals for my forecast this year, it did look kind of below average for the Front Range cities, with Western Colorado doing much better generally. Denver: July-October 1931-2021 1 2021-10-31 0.97 0 2 1962-10-31 1.24 0 3 1948-10-31 1.45 0 4 1964-10-31 1.58 0 5 1934-10-31 1.73 0 6 2016-10-31 1.83 0 7 1939-10-31 1.88 0 8 1943-10-31 2.07 0 9 2003-10-31 2.12 0 10 1978-10-31 2.32 0 11 2020-10-31 2.49 0 12 1950-10-31 2.53 0 13 1937-10-31 2.69 0 14 1933-10-31 2.92 0 15 1944-10-31 2.93 0 16 1994-10-31 3.00 0 17 2018-10-31 3.13 0 18 1932-10-31 3.15 0 19 1952-10-31 3.19 0 20 1981-10-31 3.20 0
-
QBO/ENSO/Solar are still pretty close to a 1974-75 and 2017-18 blend. Still think the QBO stuff is kind of bullshit. You can always just match on it by finding common multiples of the QBO & Solar cycle lengths and filtering by ENSO in the way a 2 year cycle and a 7 year cycle would always align at 14 years. I never actually look to match on it specifically, I just know the periodicity of the solar cycle can "look for" QBO matches so to speak. (See how 1974 and 2017 are 3 solar cycles x 11 years apart, and both off in a solar sense by ~2 QBO cycles? My sense is the weirdness with the QBO cycle recently was largely tied to it getting misaligned from the solar cycle to some extent, and so the Super Nino weirdness kind of fixed it, timing wise).
-
2021-2022 ENSO
raindancewx replied to StormchaserChuck!'s topic in Weather Forecasting and Discussion
Jan-Oct comparison for 2021 v. my main analogs with the update today. All Nino zones remained warmer at the surface than last year this October. -
2021-2022 ENSO
raindancewx replied to StormchaserChuck!'s topic in Weather Forecasting and Discussion
Euro still kind of sucks at forecasting Nino 4. But overall, the eastern zones cooled much faster in October than the Western zones. -
2021-2022 ENSO
raindancewx replied to StormchaserChuck!'s topic in Weather Forecasting and Discussion
Nino1+2 Nino3 Nino34 Nino4 Week SST SSTA SST SSTA SST SSTA SST SSTA 29SEP2021 21.2 0.5 24.9-0.1 26.3-0.4 28.0-0.6 06OCT2021 21.0 0.2 24.7-0.3 26.1-0.6 28.0-0.7 13OCT2021 20.7-0.2 24.4-0.7 26.0-0.8 28.1-0.5 20OCT2021 20.3-0.7 24.2-0.8 25.9-0.8 28.1-0.6 27OCT2021 20.6-0.6 24.1-0.9 25.6-1.1 28.2-0.5 30SEP2020 20.0-0.8 24.4-0.6 26.0-0.7 27.9-0.7 07OCT2020 20.1-0.7 24.1-0.9 25.8-0.9 27.9-0.7 14OCT2020 20.5-0.4 24.1-0.9 25.6-1.1 27.8-0.8 21OCT2020 20.5-0.6 24.2-0.9 25.5-1.3 27.8-0.8 28OCT2020 20.3-0.9 23.8-1.3 25.0-1.7 28.0-0.7 We remain warmer at the surface v 2020. I've included in ( ) the 1967, 2001, 2011 blend for the main zones I mentioned in my winter outlook for October. We're a bit less east based at the moment than I had it, but not much. It's mostly because Nino 1.2 has been so much warmer than that blend. October on the weeklies implies: Nino 1.2: 20.65C Nino 3: 24.35C (24.03C) Nino 3.4: 25.85C (26.07C) Nino 4: 28.10C (28.38C) The October subsurface reading was -1.67 for 0-300m depth at the equator in the Pacific. Tracking very similar to 2011 still, but colder below. There is evidence of the subsurface warming now though. Surface peak may be November (that's pretty common). The Canadian seems to over-amplify ENSO strength every October, then back off in November - so you do have it showing a much weaker event now for winter. That said, I do think the Canadian is pretty good at identifying temperature patterns for the next month. My main analogs for winter were 1974 and 2017. The blend is pretty similar to the Canadian. That said, I did weight the five years blend I used pretty differently. I'm a lot closer to what the CFS showed for November. My winter blend is pretty close to a simple blend of 1974 and 2017 for temperatures, even with the three other years added in, so I actually find this encouraging for an analog package I put together from late-September to early-October. -
2021-2022 ENSO
raindancewx replied to StormchaserChuck!'s topic in Weather Forecasting and Discussion
This is the top objective SOI match to August-October 2021 using 1931-2020. It's a super cold look for November, although the closest match is 1942, which is a very warm November. SOI Aug Sept Oct 1935 2.1 6.4 7.9 1942 3.9 8.7 9.2 1974 6.3 12.2 9.2 1996 4.8 6.9 5.2 2000 4.5 10.1 11.6 2011 2.6 11.1 9.7 Blend 4.0 9.2 8.8 2021 4.4 9.2 7.6 The five analogs I like for winter are damn close on the SOI too if you remove 2001, which I have in there for some special reasons. The blend I used doubled 1961 and added 2001 to the four years below, but it's still very similar to that look. SOI Aug Sept Oct 1961 -0.3 1.1 4.7 1974 6.3 12.2 9.2 2017 3.5 6.1 10.6 2020 8.4 9.9 4.4 Blend 4.5 7.3 7.2 2021 4.4 9.2 7.6 My personal view is global warming in a lot of patterns just means cold looks show up later. So I think the severe cold in the first blend probably does arrive. It's just not til the very end of the month, or at least after 11/15 or 11/20. If that's the case, I think what I have (and what the CFS shows now) is closer to the truth. -
2021-2022 ENSO
raindancewx replied to StormchaserChuck!'s topic in Weather Forecasting and Discussion
This event, if you use my dulled scale, is definitely not super weak, but it remains well below the stronger events of even the past 35 years, let alone since 1950. A lot of La Ninas feature a big area of waters 1.5C below average or colder in October. You don't really have that with this event. In general, October looks like a blend of 1999, 2011, 2020. I would say since 1985, the strongest October La Ninas are 1988, 1998, 2007, 2010. Then you have the events that are developed by October, but lacking a huge area of very cold waters at the surface. Last year's event was actually a top 10 event cold-ENSO in Oct-Nov before falling off a lot. The remaining events were weaker and not fully developed in October. These are the "late peak" and very weak events. -
2021-2022 ENSO
raindancewx replied to StormchaserChuck!'s topic in Weather Forecasting and Discussion
Weatherbell has the "super ACE" La Nina composite for NDJ on the Saturday Summary today. Will be curious to see how that goes. I'm actually not that different from what he has in Nov & Jan, just warmer. Have to see if these November 'x' systems on the NHC site can blow up the ACE value past 160. I'm pretty skeptical about December being super cold, mostly because I think November gets pretty cold after 11/15 or 11/20 and then it lasts into December and fades hard before 12/31


