so_whats_happening
-
Posts
1,581 -
Joined
-
Last visited
2 Followers

About so_whats_happening

- Birthday 03/21/1991
Recent Profile Visitors
9,506 profile views


-
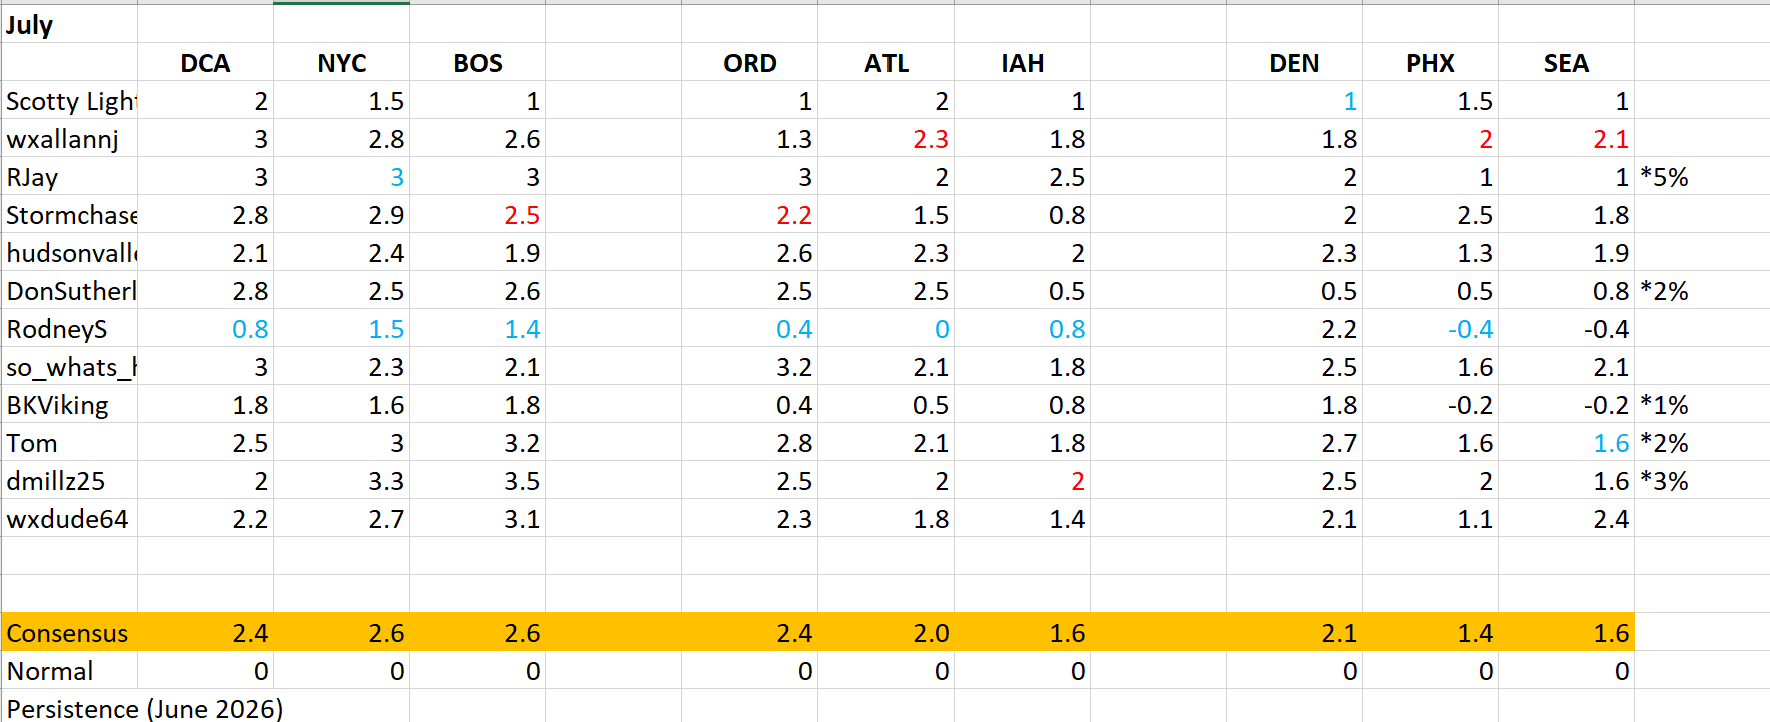
Sorry yes please post your anomalies for August below do so before 6z (2am eastern time) August 1st. So far Don S. still holds a solid lead but we are getting into the time of year where things will start to be a bit more chaotic and forecast moves can happen quick.
-
2026-2027 Super El Nino
so_whats_happening replied to Stormchaserchuck1's topic in Weather Forecasting and Discussion
Unfortunately starting from a record low in winter will have this happen. The area of 80N and even close to 70N has been near normal or below normal temp wise most of the summer thus far. This is what you want to see in a good retention year but again starting point always matters. If this holds into August we should continue to slide above that 2012 number and get more inline with recent years probably 6-8th lowest roughly. Im honestly surprised more so we didn't take a massive hit this year but presume next year will likely start another leg down. Fingers are crossed it doesn't. -
Here some max temp so far DCA: 103 (7/4) may be challenged tomorrow? NYC: 100 (7/2) BOS: 101 (7/2) ORD: 95 (7/1 & 2) ATL: 98 (7/2) IAH: 97 (6/29) DEN: 97 (several days thus far) PHX: 113 (several days) SEA: 91(6/15)
-
2026-2027 Super El Nino
so_whats_happening replied to Stormchaserchuck1's topic in Weather Forecasting and Discussion
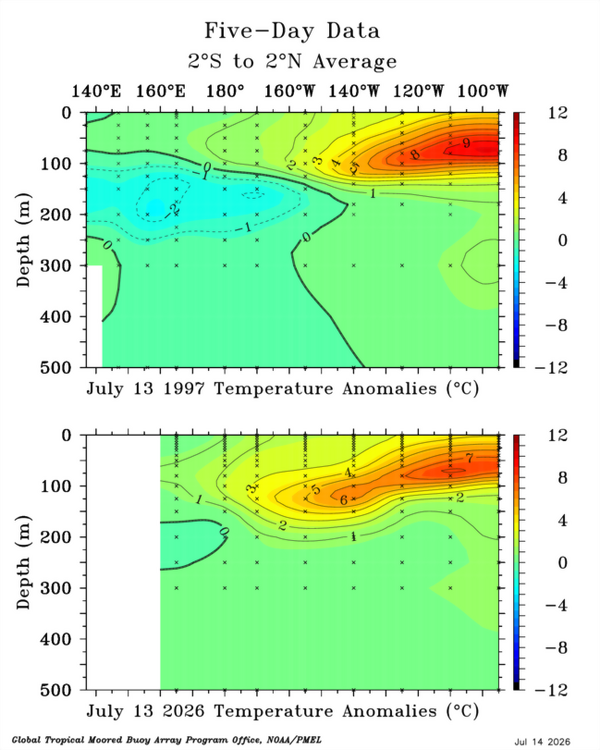
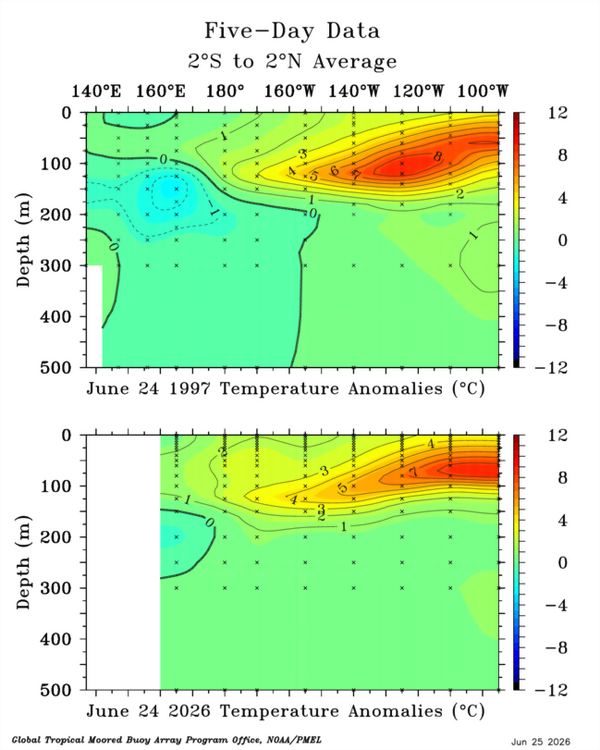
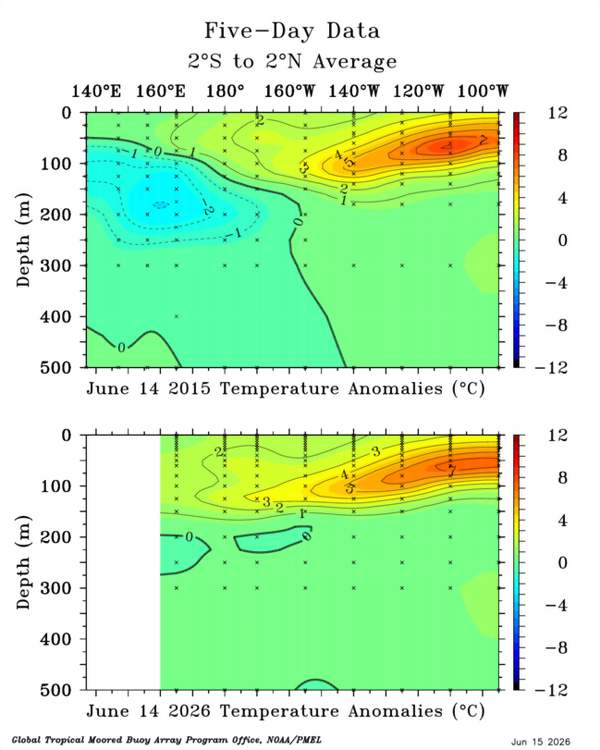
We have had this since about March around here going from 80-85 then accumulating snow the next then back to the low 80s. I would say that is more of a fall feel for this area but here nor there it has been very much back and forth. Setting some record cold lows and highs within the same month. Only thing I have noticed that we are in an increasing el nino state is the lack of tropical activity and the slightest of increase in rainfall over the last 2 months around here. This will ultimately be fun to see what happens with this next subsurface feature. Again that slight distorted look we see in the thermocline is an artifact of the -PDO state still holding. Losing its grip compared to 3 years ago during the last Nino event but still present for now..thumb.gif.fbaadca50649e550ee4525ea3f57d90a.gif)
-
2026-2027 Super El Nino
so_whats_happening replied to Stormchaserchuck1's topic in Weather Forecasting and Discussion
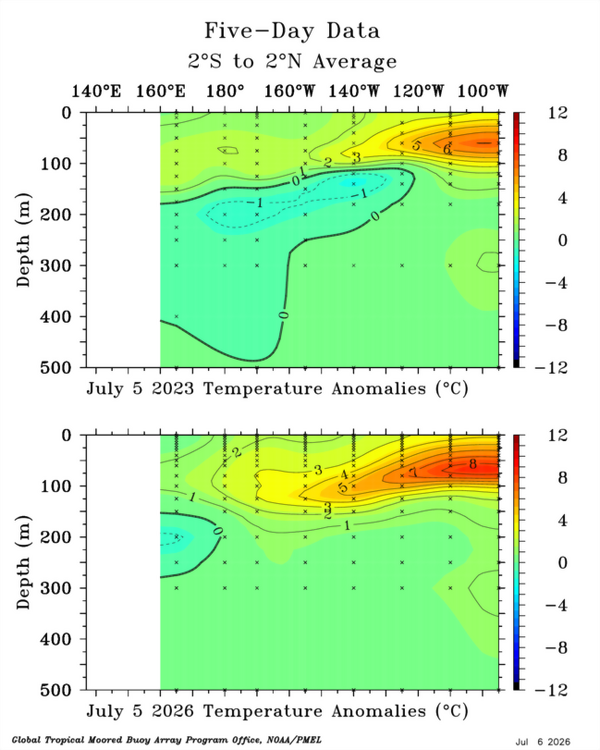
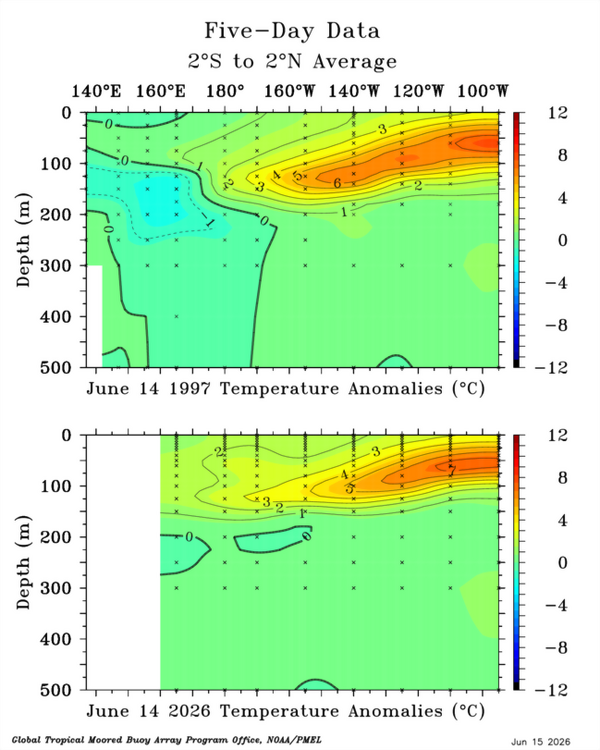
The difference in overall depth of the warm anomalies looks to be an artifact of the -PDO still being around. During the 2023-24 Nino this was centered around 130-140W. We also are lacking a significant negative anomaly region developing near the Dateline. I gotta ask the question though are we seeing Nino take on a new form with SSTs the way they are globally?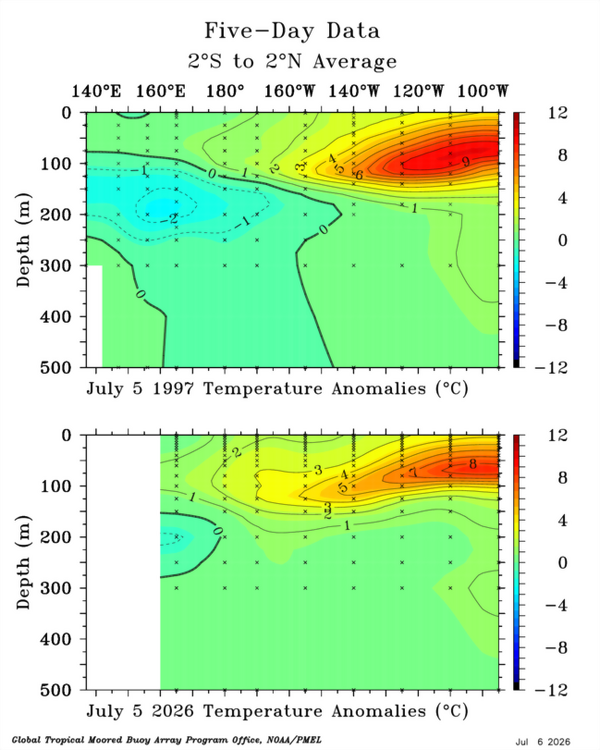
-
2026-2027 Super El Nino
so_whats_happening replied to Stormchaserchuck1's topic in Weather Forecasting and Discussion
Im not going to play catch up since I have last been on here but here is TAO from May through July 4th, I'll be taking out May next update around mid month..thumb.gif.b6a5e787aef93ab1c7862c0e7be4773c.gif)
-
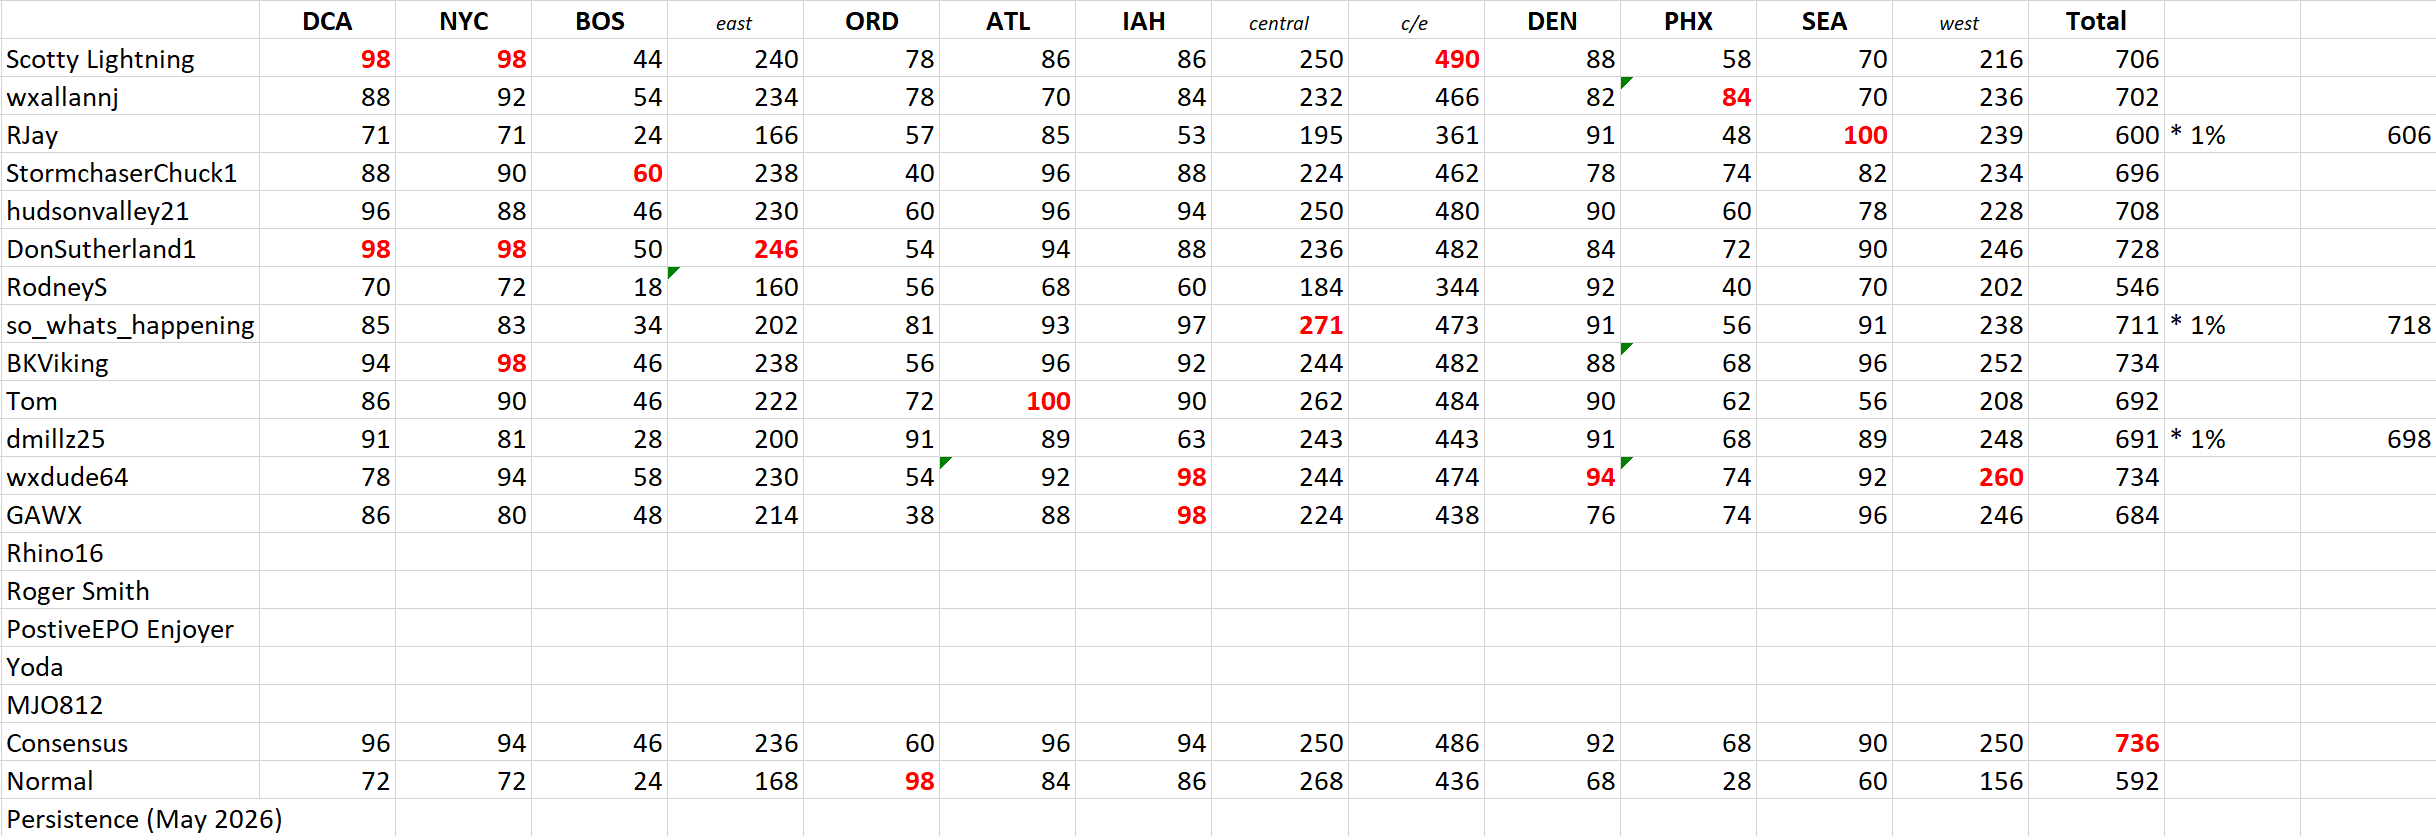
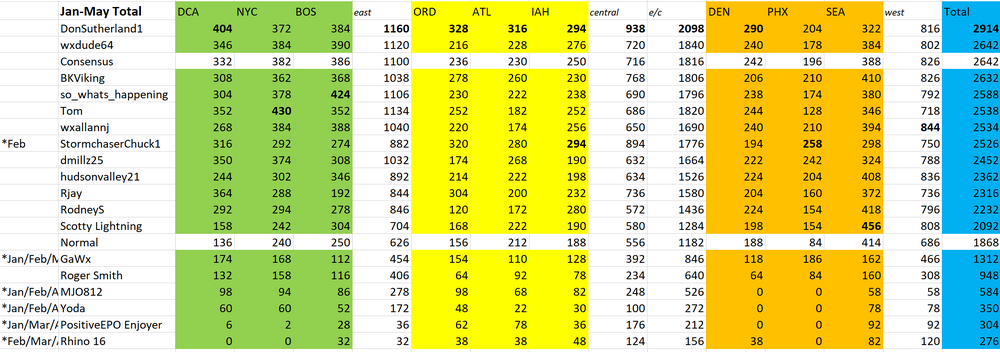
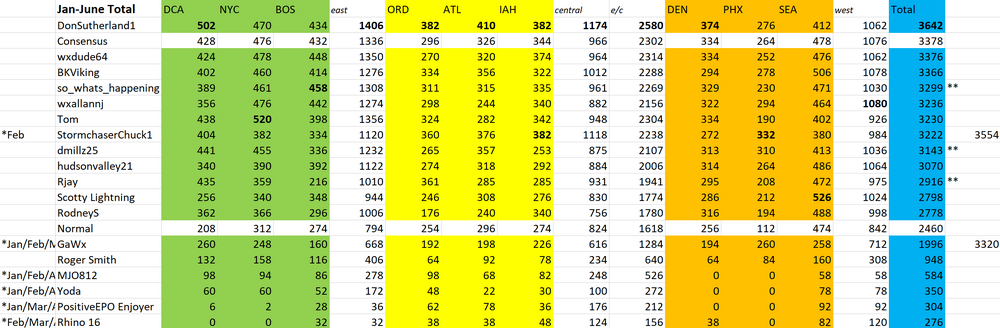
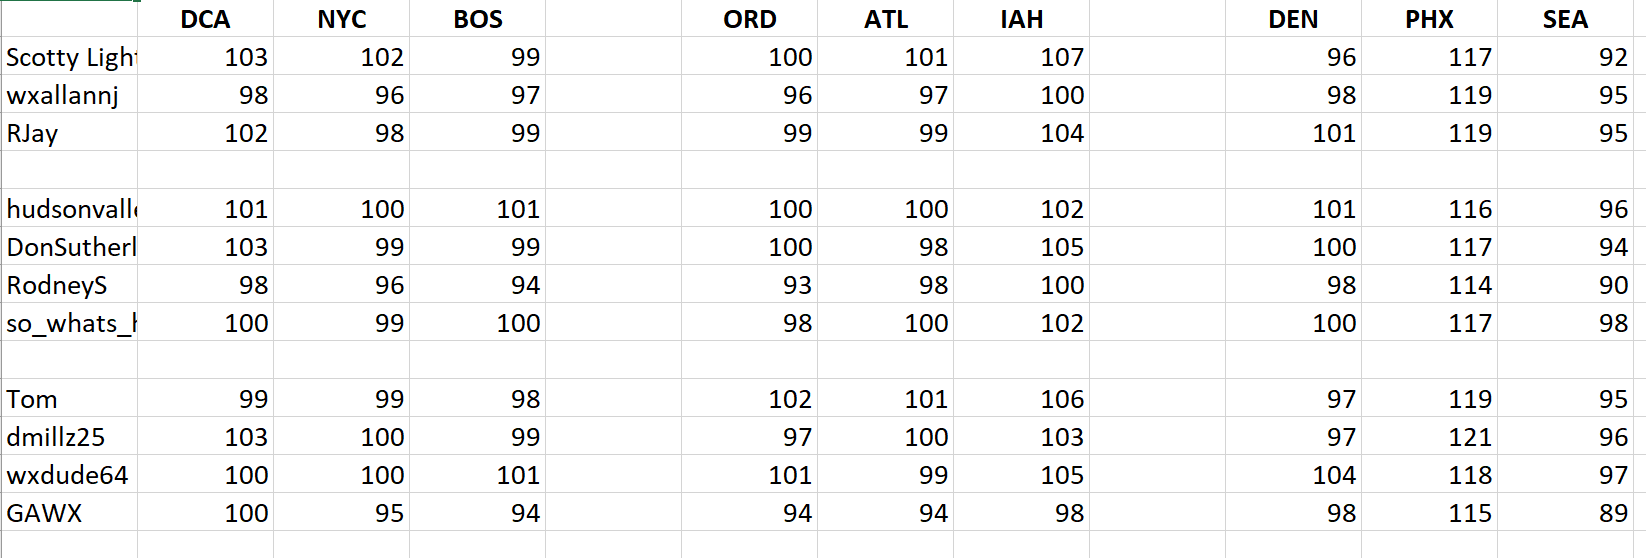
If anyone finds discrepancies in the numbers please let me know. For the deductions for June I picked 7 stations to knock down 1 point and 6 stations for RJay.
-
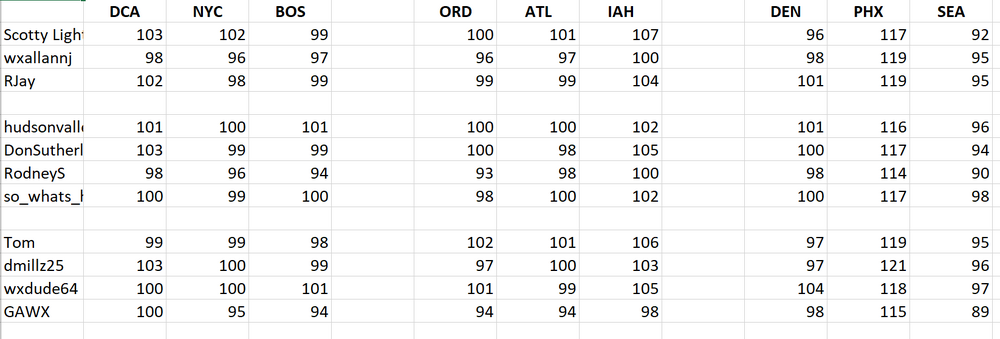
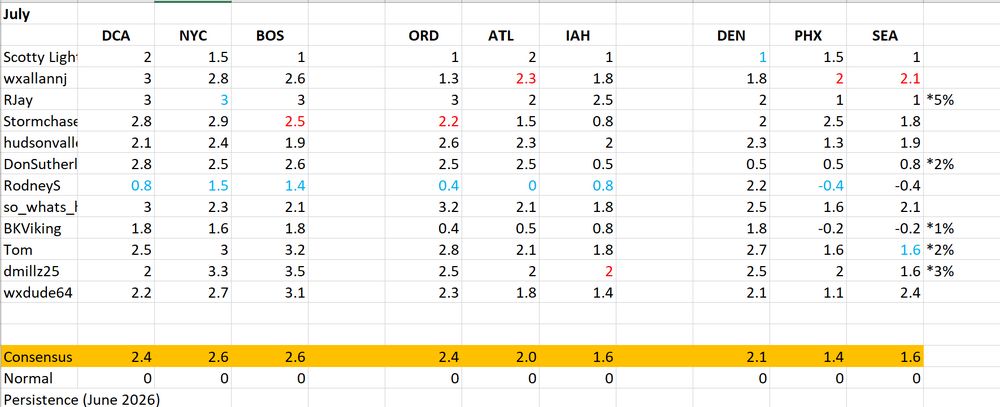
Im honestly debating on the late entries for this month (July) as it stands these are the forecasts and the what coinciding late entry percentages look like. Ill maul it over and if see if anyone else wants to chime in about it. Ill see if I can also do a quick update for max temps and where they stand thus far in a week or so.
-
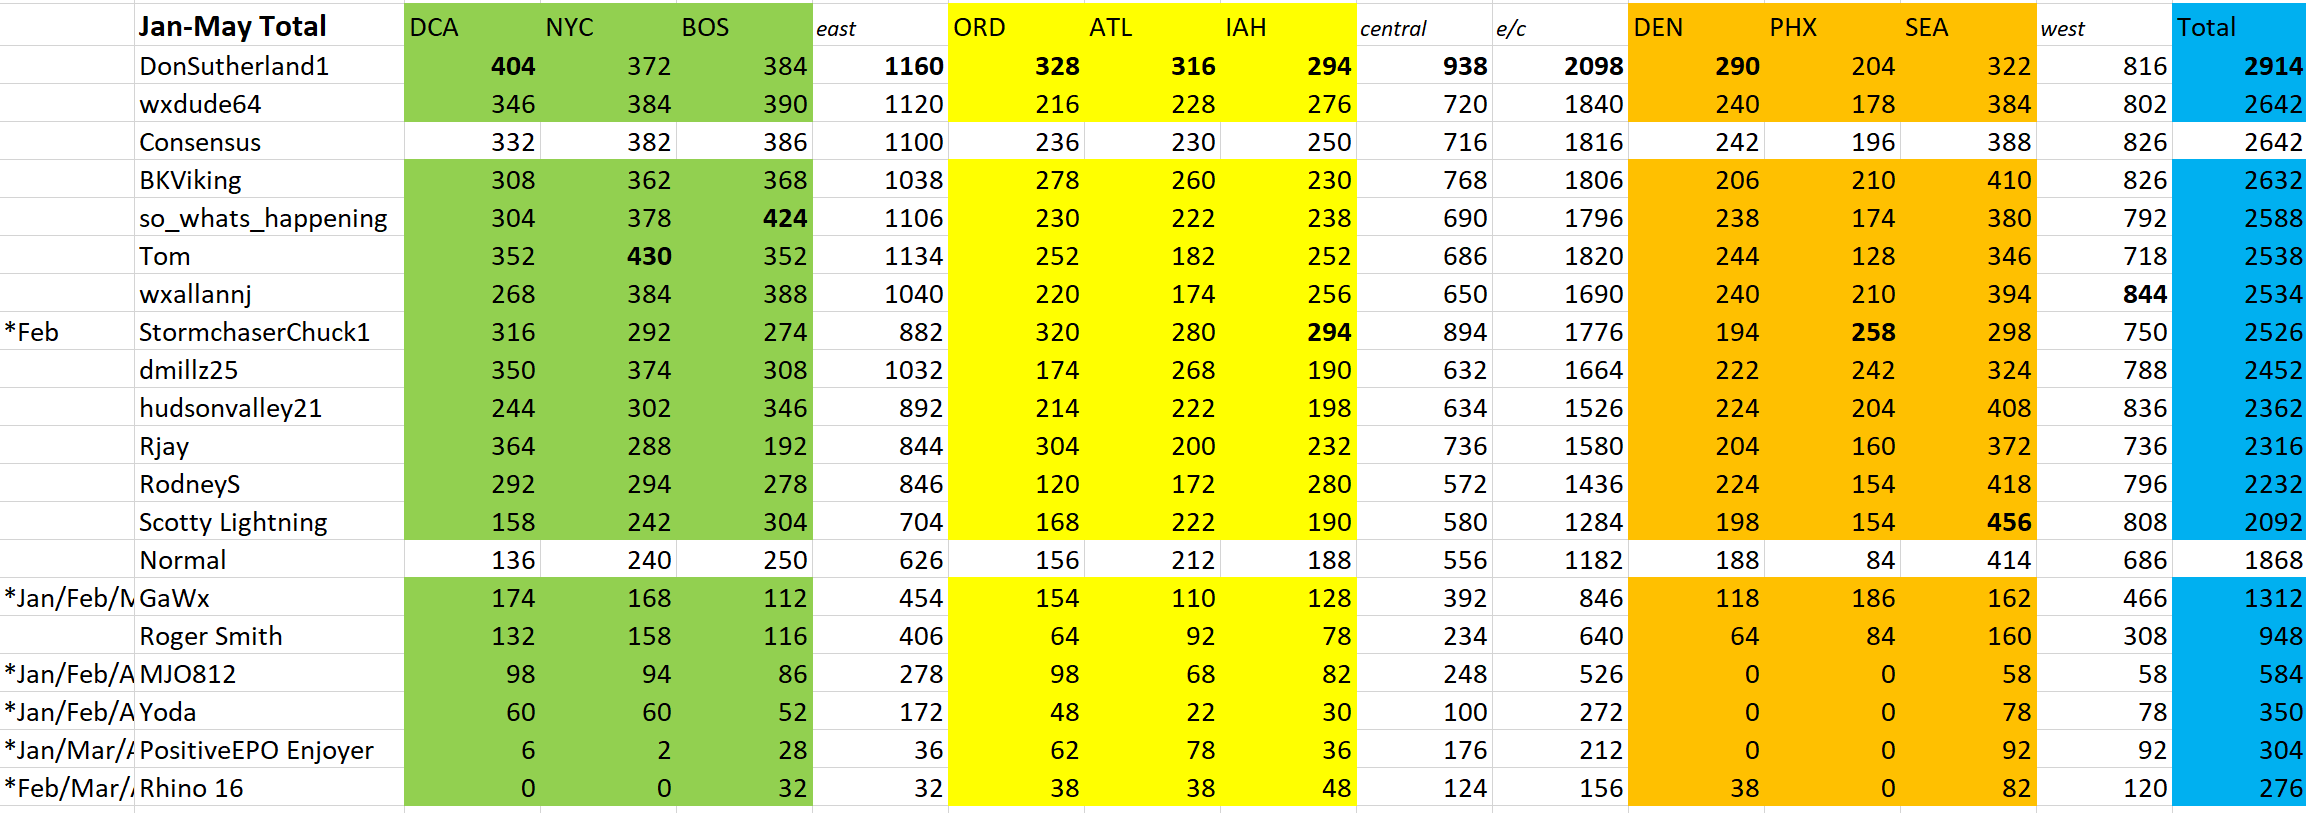
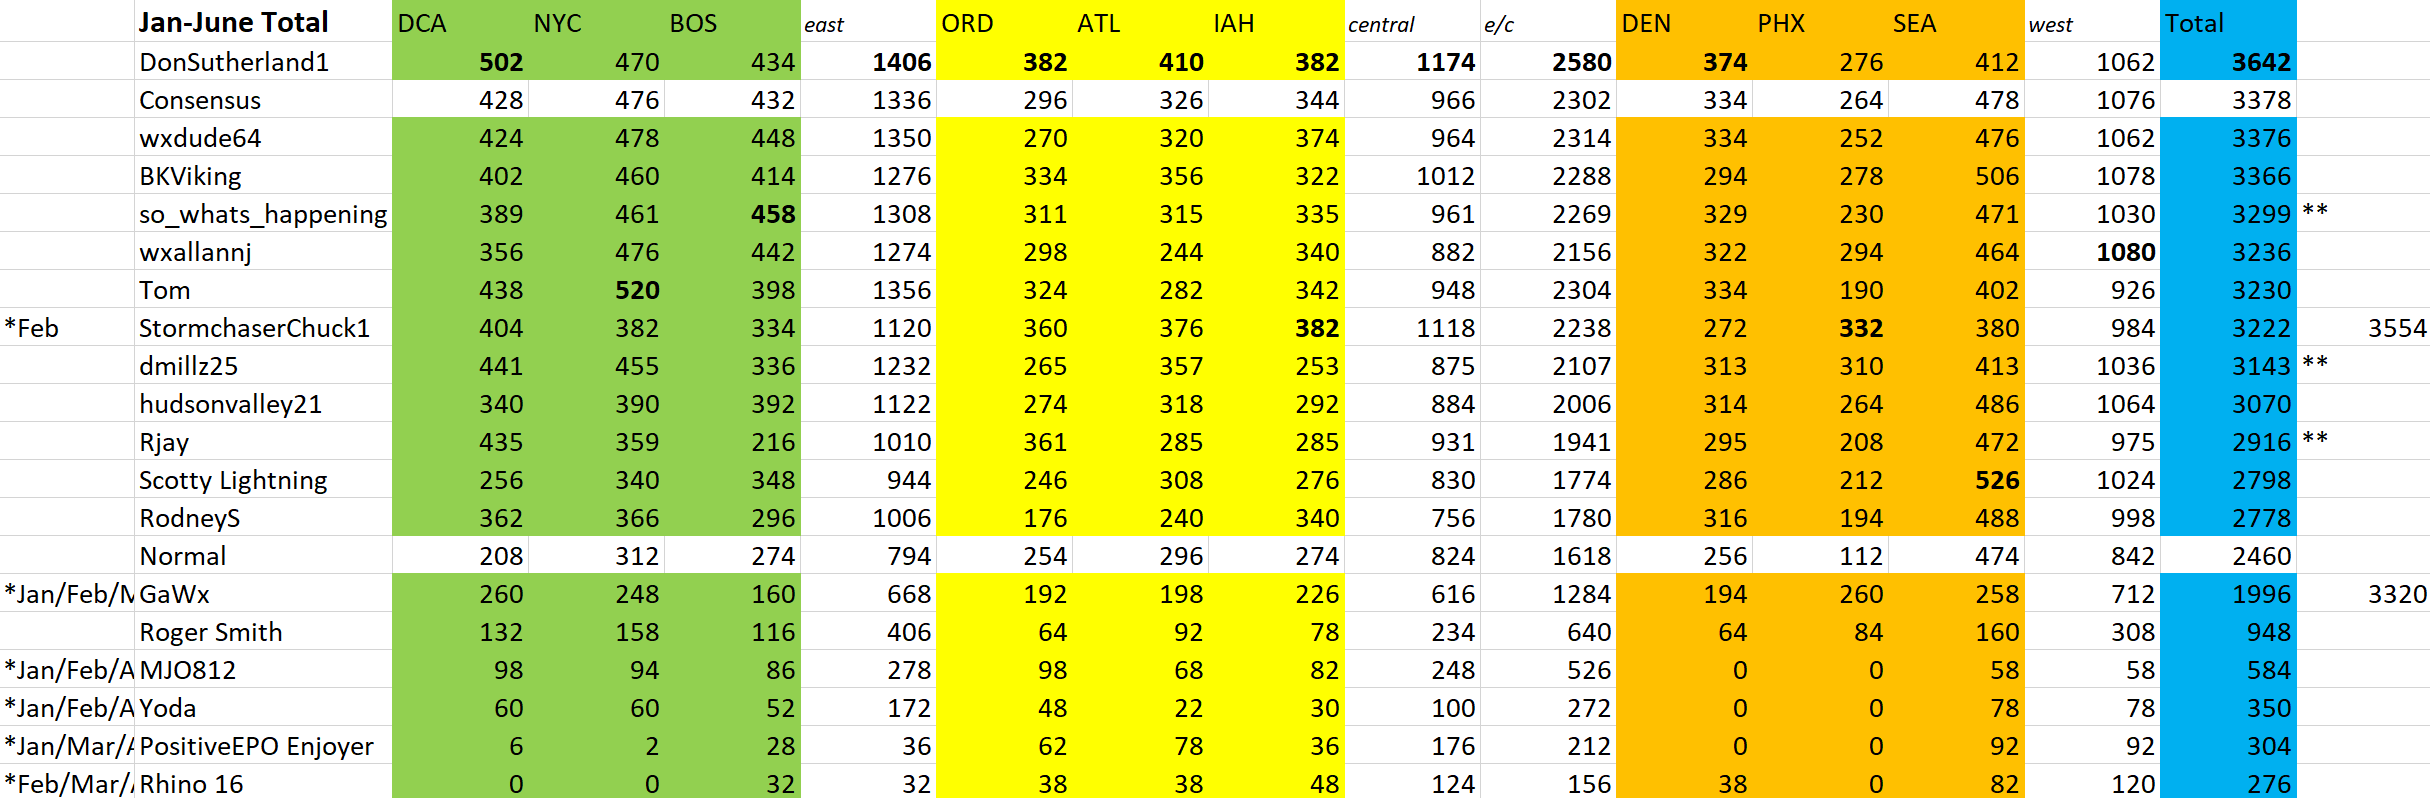
Ok sorry for the delay got back on the 4th and was bombarded by storms, lost power and internet. Then yesterday we had flash flooding still no power, hope it comes back tomorrow. We had very little movement in numbers. We had a few late entries and they are marked with * 1% for those affected most were 7 points off RJAY ended up only 6 points off the original total so not much of a difference. I included a consensus number to both GaWx and Stormchaserchuck for the months they were missing to get an idea if they had played through where they would stand in the far right column.

-
@Rjay @GaWx I think are the only 2 that have not submitted. Up to folks how they want to handle the late entries (quite a few by just a few hours). Ill be back early on the 5th so I should be able to post updates, iffy connection at times so hopefully this goes through. Happy 4th everyone!
-
2026-2027 Super El Nino
so_whats_happening replied to Stormchaserchuck1's topic in Weather Forecasting and Discussion
-
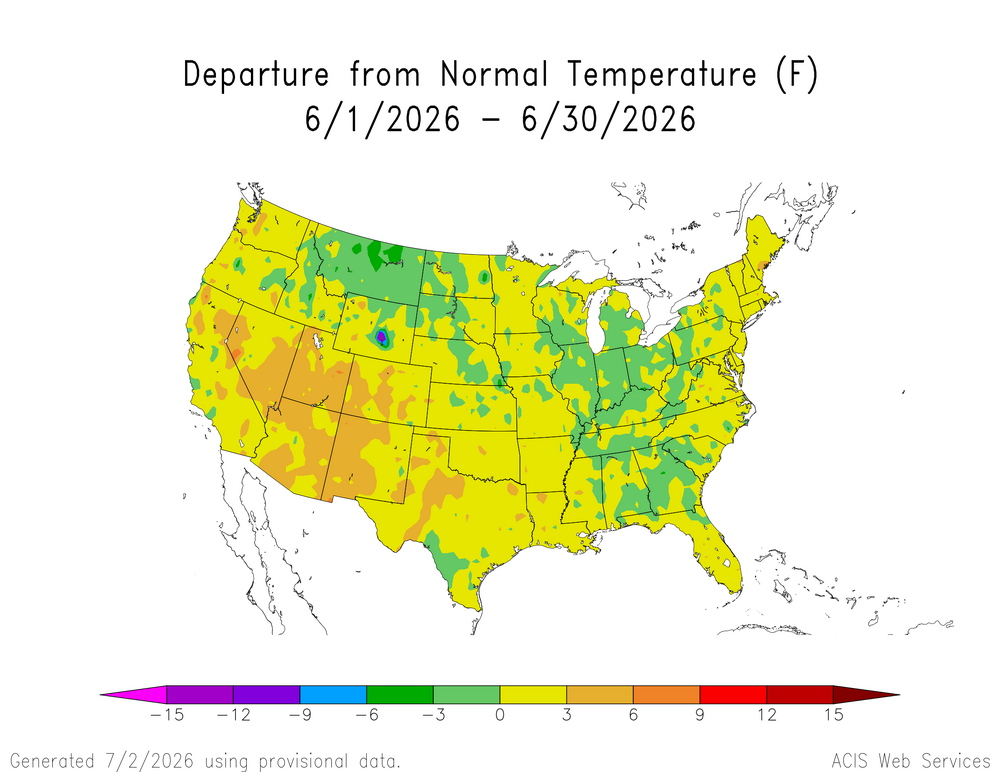
DCA: +3.0 NYC: +2.3 BOS: +2.1 ORD: +3.2 ATL: +2.1 IAH: +1.8 DEN: +2.5 PHX: +1.6 SEA: +2.1
-
Sorry I probably should have worded it a bit better. They are Max temps for the entire summer at those locations.
-
Good morning folks please place July forecasts below when you get the chance with the typical deadline of July 1st by 6z. I will be away for vacation from the 28th to the 5th of July so Ill do my best to compile all the values when I get back then. Ill try to do a quick update before I leave of what the results of June will look like around Friday (26th) since there shouldn't be major changes that occur.
-
2026-2027 Super El Nino
so_whats_happening replied to Stormchaserchuck1's topic in Weather Forecasting and Discussion

.gif.7a1f57685c45ddf34b8ee60f840bc28f.gif)


.gif.4e45cd1241a8aea0baf60fd74c1a9574.gif)