

gymengineer
-
Posts
3,358 -
Joined
-
Last visited
Content Type
Profiles
Blogs
Forums
American Weather
Media Demo
Store
Gallery
Everything posted by gymengineer
-
He’s certainly ruffled a lot of feathers lately for a bunch of other reasons.
-
Fun fact for the newer posters: Ray Martin worked at LWX and would post here. After the 2016 Blizzard, he participated in the heated discussions on here about DCA’s snow total for the storm.
-
It’s probably because you had to stay up overnight to see the peak of it. It started when most people would be going to bed. By the time I walked outside at 9 am, my street was already plowed. We (weatherboard folks) spent the rest of the day waiting for the ULL backside snow. The RGEM spit out an insane solution on one run of like 15”+ with the ULL passage.
-
This was the storm that caused the panic on Wednesday after the blizzard because the ETA run showed over a foot of snow/sleet for the region. And this was after the clipper surprised everyone with 3-6” from DC eastward on Tuesday. By later Thursday, the models had cut back QPF so the forecast was for a moderate snow to sleet storm, not another new crippling situation.
-
Since when has Roger Smith become a comedy act? His travelogue and spiritual counseling comment as the whole “Are you driving over the Blue Ridge to get to Winchester?” discussion was going on made me laugh out loud.
-
The best part was the predictions were often more accurate than what others in here were predicting because the totals were model blends, whereas others hoped against hope that the model with the snowiest solution would verify.
-
Nice research! Just a couple of notes on these quoted dates: The blizzard of 2/78 was a also a significant snowstorm from the northeast DC suburbs and northeastward, including Baltimore and especially northeastern MD. Immediate DC and west of the city did miss out. 1/26/61 was the only significant snow you missed on your entire list. 5.9” storm for DC. The end of January 2007 was notable not for a specific storm but for marking the pattern change that brought a wintry and very cold February.
-
The contrast here between Monday and last night, when I woke up to watch it fall between 1:30 and 4, was pretty striking. Heavy, wet snow on Monday overcame daylight and 60’s the afternoon before to efficiently stick on roads. Fluff during the dead of night did not.
-
Probability of >4” pretty high in this product:
-
Fozz and BobChill Bizarro-world with the NAM and GFS reversing roles in the QPF.
-
December 15th-16th Warmth, Wind, and Severe Threat
gymengineer replied to Geoboy645's topic in Lakes/Ohio Valley
So 12 preliminary EF2 tornadoes within a derecho. This must be unprecedented, right? -
The smaller towns in between will take longer for their stories to be told. This is Bremen:
-
Also, here's LWX's Local Storm Report about the record: 000 NWUS51 KLWX 292317 LSRLWX PRELIMINARY LOCAL STORM REPORT NATIONAL WEATHER SERVICE BALTIMORE MD/WASHINGTON DC 716 PM EDT FRI OCT 29 2021 ..TIME... ...EVENT... ...CITY LOCATION... ...LAT.LON... ..DATE... ....MAG.... ..COUNTY LOCATION..ST.. ...SOURCE.... ..REMARKS.. 0642 PM COASTAL FLOOD SOLOMONS ISLAND 38.32N 76.45W 10/29/2021 ANZ542 MD MESONET THE NOAA TIDE GAUGE AT SOLOMONS ISLAND INDICATED THE GREATEST TIDAL CREST IN ITS RECORDED HISTORY, REACHING 4.46 FEET THIS EVENING AT 6:42 PM EDT. THE PERIOD OF RECORD INCLUDES THE PREVIOUS HIGHEST CREST, WHICH WAS RECORDED DURING HURRICANE ISABEL ON SEPTEMBER 19, 2003. && EVENT NUMBER LWX2106269 $$ LEE
-
Using this from weather.gov: https://water.weather.gov/ahps2/hydrograph.php?wfo=lwx&gage=slim2 4.81 vs. 4.45
-
Solomons Island, MD, easily beat their all-time record highest water level, with water still rising until 10 pm. Here are the storms tonight's water level beat, from now 2nd place on down to 7th place: Isabel, Ernesto, Ash Wednesday '62, Connie, Fran, and Juan remnants.
-
Alexandria already in with the third highest water level behind Isabel and 1936, before what was supposed to be the highest peak tonight: https://water.weather.gov/ahps2/hydrograph.php?wfo=lwx&gage=axtv2 I think that list is definitely missing some events, though, like Fran, Hazel, etc. Cambridge, MD, is going well ahead of the forecasted curve: https://water.weather.gov/ahps2/hydrograph.php?wfo=akq&gage=camm2
-
There’s another prominent member too, like years and years active on the boards. But I’ll let him find his way to this thread.
-
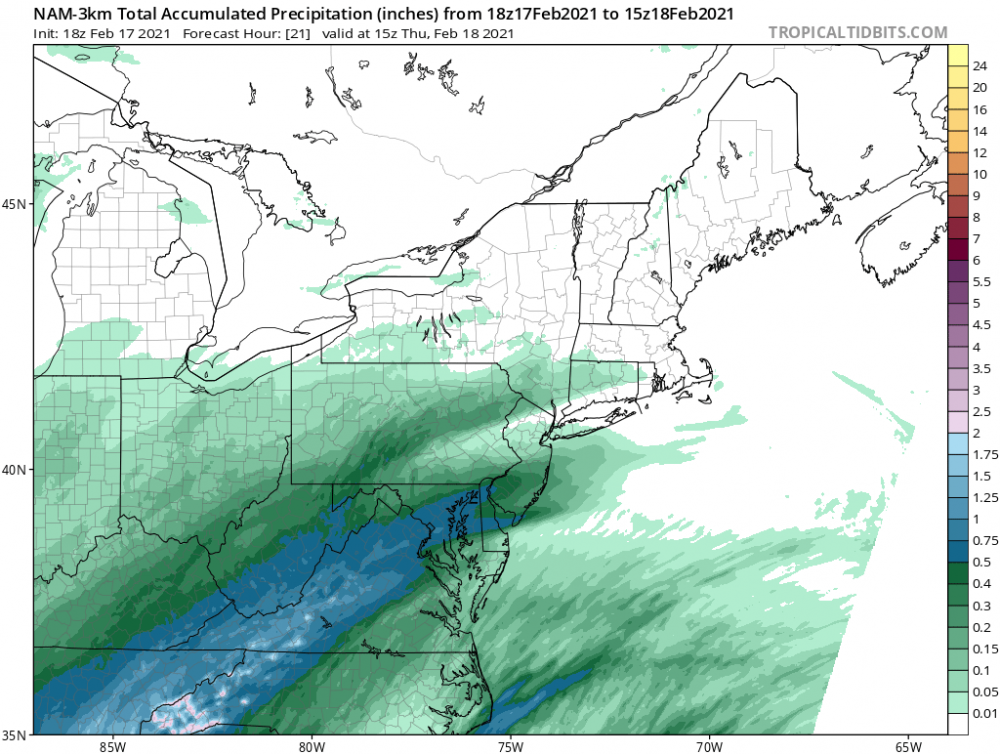
Did you peak at the 18Z GFS? It still is showing 0.4”+ (!!) liquid for the DC area until tomorrow afternoon. And in the very short term, 0.1-0.2” liquid between 7 pm and 1 am. It’s all alone at this point. After the totality of everything this season, this is just another example of how degraded model performance has been.
-
Even in that people sure were miserable during the dry slot
-
Yup, the high at IAD was 15F and 19F on the 2 days leading up to the event (2/19/15 and 2/20/15). Superb airmass that the models just didn’t have a good handle for and hence our great positive bust here in the suburbs.
-
I think he’s referring to the 2/21/2015 event? The 2/2014 2-parter was a coastal storm.
-
Is part of the issue for soundings vs. sleet or snow output on TT the color scheme? That first purple color for puking snow is awfully close to, if not the exact same shade, as one of the sleet shades of purple.
-
As Matt said, something’s off about the WB Kuchera map. This is the hour DC and southwest flip to sleet. The 0.5+” band is narrower than in the 12K, but its nowhere as funky as the Kuchera map suggests.
-
Most of my colleagues have gotten the second Moderna shot. Every single one had one or more of the following symptoms: fatigue, chills, body ache, muscle soreness, fever, severe headache. I am planning on taking Tylenol after the shot before going to bed.
-
Feb Long Range Discussion (Day 3 and beyond) - MERGED
gymengineer replied to WinterWxLuvr's topic in Mid Atlantic
Your quote let me see the typo I had in the original post- 2/21/15, not 2005. That’s the event you are referring to as well, I believe. One of the best day-of overperformers of all time. We were staring at the sleet line just not advance on the CC loop while it was hours of heavier than modeled snow accumulating during peak sun angle hours.


