chubbs
-
Posts
3,786 -
Joined
-
Last visited
Content Type
Profiles
Blogs
Forums
American Weather
Media Demo
Store
Gallery
Everything posted by chubbs
-
No pain at all. You aren't producing any evidence and I am used to your rhetoric. I have a question about the coop data. Researching station histories at NCDC, several coops are shown as having rain gauge data only, no temperature data. Chadds Ford, Glenmoore, and Honey Brook have no temperature data at all. West Grove only has temperature data from 1963 to 1976, rain gauge only before that. I had obtained data for those stations from IEM; but, on checking, the IEM temperature data is flagged as “estimated” in the station data table. Apparently IEM backfills from surrounding stations when coop data is missing. Looks like historic Chester County data is even more limited than we thought. Can you check?
-
Sorry Paul. More data is your hands results in a poorer analysis and a loss of the warming signal. Why? You don't know how to analyze it. More data in NOAA's hands results in a better analysis. NOAA is using much more data than you are.
-
You aren't listening. Averages of an ever-changing network are skewed, doesn't matter how you tweek them..
-
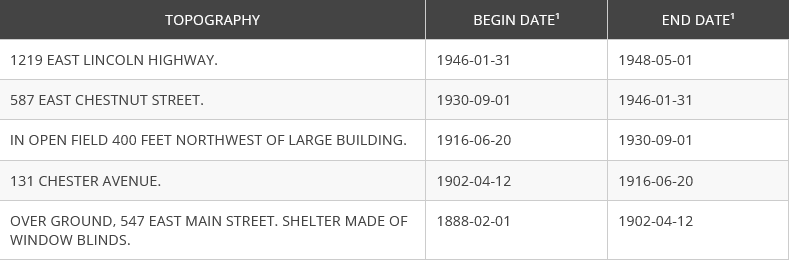
Now that I've found out about the station moves at Coatesville. It is likely that the relative cooling at Coatesville after the war is caused by the station move to a more rural location. Per NCDC, there are two post-war station moves: one in early 1946, and a second move in 1948. After 1948, NOAA matches the Chescowx (two Coatesville stations and East Nantmeal) closely. This is raw coop data from 2 Coatesville stations and Pauls's house in East Nantmeal. All relatively rural after 1948. Before 1948, NOAA matches the bias-adjusted values for Coatesville. Per chart above the Coatesville experienced a city-->rural move related warming that deserves a bias adjustment. As shown a few posts up, Coatesville had more 95 days than Phiadelphia before the move. More strong evidence that NOAA is spot on and Chescowx is way off.
-
I agree completely with your first sentence. We have a much better network today. Better equipment and different locations, not restricted to the warmer parts of the county. But you aren't telling us anything about the climate, only how much the network has changed. You have stacked the deck against warming, by throwing in a lot of cooler stations at the end of the period. Stations with different characteristics than the COOPs, which skews the trend analysis cooler and you still find a warming trend..
-
The list demonstrates that Martz doesn't know what is important (not that we didn't know that). For example It is impossible and unnecessary to determine the average global temperature. Temperatures can vary significantly over short distances. You would need orders of magnitude more thermometers to get a good global average. Fortunately it is much easier to determine the trend in global temperature. As I keep repeating, the year-to-year change in temperature is well correlated over roughly 1000km. Per the paper linked below, you only need roughly 60 stations to get a good estimate of the global trend. There are more than enough weather stations to prove that it is warming globally. Similarly it is impossible to determine the average temperature in Chester County. The historic monitoring network doesn't come close to providing enough coverage. The county is highly variable: cities, suburbs, rural, many types of ag, forests all at varying elevation. Much easier to determine the trend in temperature in Chester County. Since weather data is correlated over 1000 km a large number of stations can provide useful information and it is easy to correct County stations that move or have biased data. As a result the long-term trend in Chesco is very accurately determined by NOAA and other groups even though there are only a handful of long-term county weather stations. https://journals.ametsoc.org/view/journals/clim/7/12/1520-0442_1994_007_1999_satoeo_2_0_co_2.xml
-
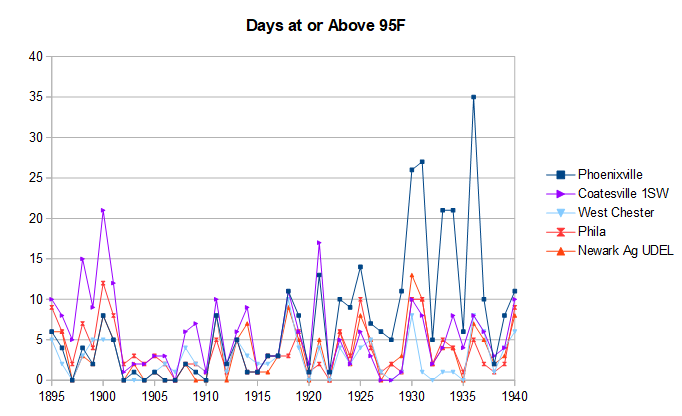
Not only is the 1936 record at Phoenixville flawed, Chesco's whole notion that the 1930s summers were warm in Chester County is questionable. Remove Phoenixville and the # of 95F days plummet in 1930s and 40s. Also note the smaller spike in 95F days at Coatesville in the 1890s+1900s. The NCDC station station notes for Coatesville (below) state that window blinds were used as a temperature screen around 1900. Also the station was located in the city of Coatesville in the 1890s and 1900s, then moved to a field, then back to the city, before finally relocating to a more rural site in the late 1940s. It was only in the late 1940s, at a more rural location, that Coatesville started to have fewer 95 days then Philadelphia on a routine basis.

-
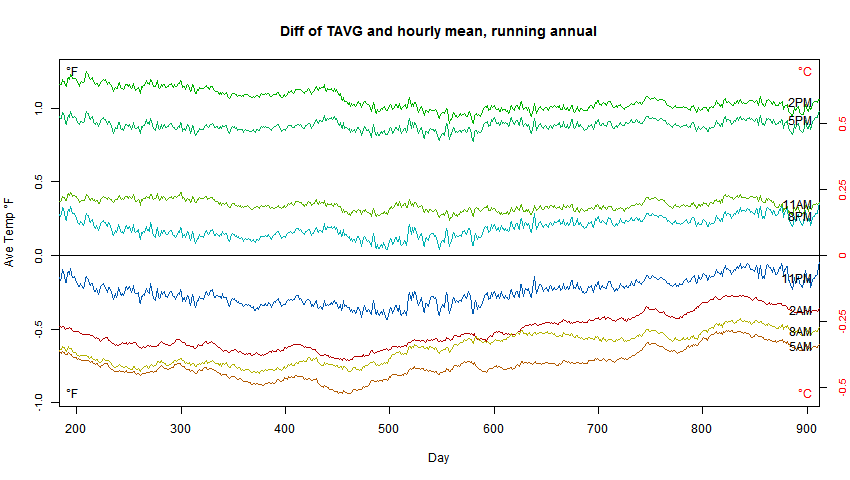
This blog has a nice chart which shows how the daily average temperature changes as the obs time changes. Its based on several years of data at Boulder, CO. The chart is fully consistent with Vose et.al. https://moyhu.blogspot.com/2014/07/tobs-pictured.html
-
Phoenix Experiences its Hottest June on Record
chubbs replied to donsutherland1's topic in Climate Change
Me either. -
Agree, probably shelter-related. Easy with a non-aspirated thermometer. The whole region gets the same day-to-day weather so there's a wealth of information in the coop data that's revealed by inter-comparing sites. Been telling Chesco that for years.
-
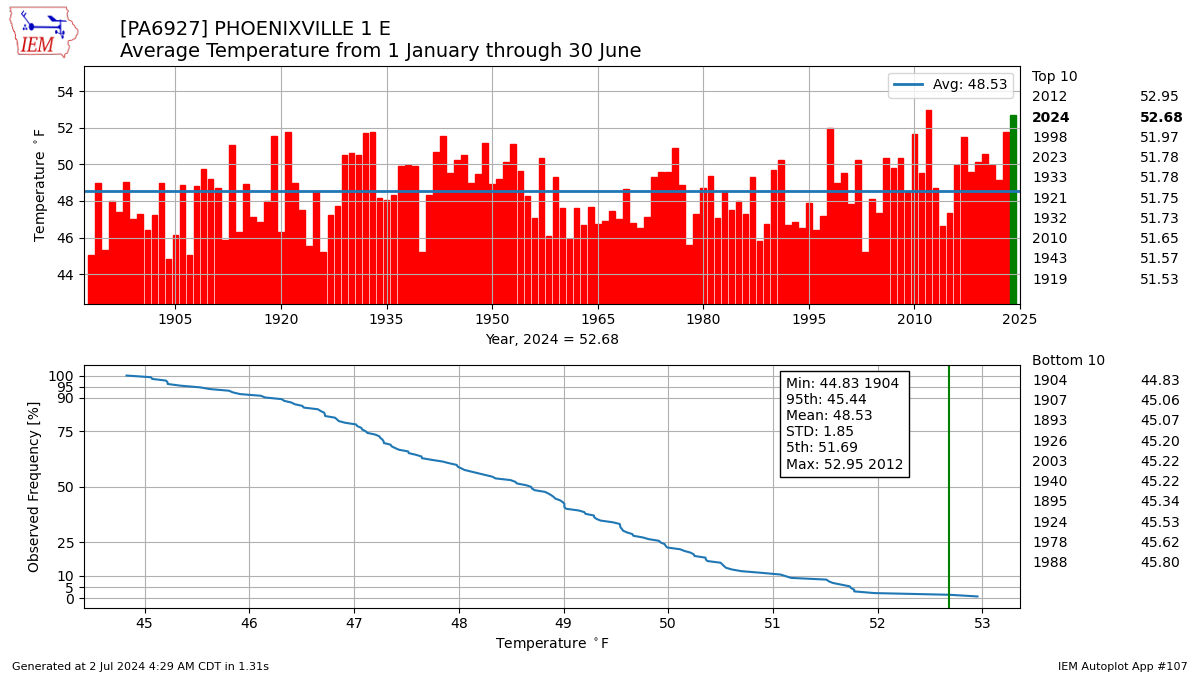
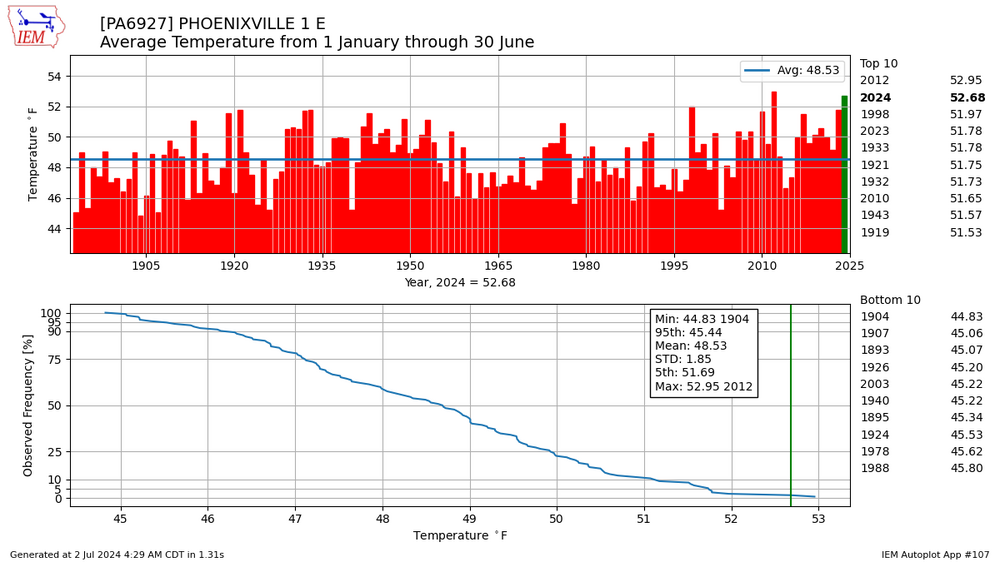
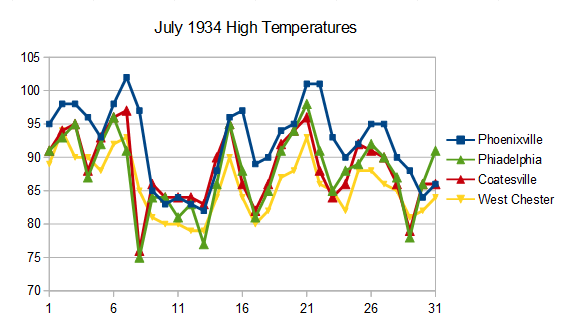
I've looked at a couple of the individual months, July 1934 shown below. In addition to an overall warm afternoon bias. Phoenixville also must have flipped the max/min thermometer in the late afternoon, allowing hot days to be double counted. When the weather tuned cooler, Phoenixville often missed or lagged the cooling observed at other sites. Note that the difference vs neighboring sites was largest on the coolest days. A good illustration of time of day bias. Despite the obvious warm season bias at Phoenixville in the mid-20'th Century, this June was the 6'th warmest ever at Phoenixville and, as shown below, the year to-date is running #2 behind 2012. Strong evidence that Phoenixville (and Chester County) is warmer now than the 20'th century.
-
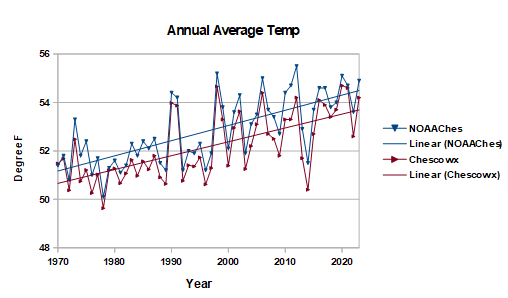
You didn't understand my point. The best way to evaluate whether NOAA the Chesco long-term temperature trend correct is to use reliable stations with long-term records, your house included. The stations I trust, including your house, both inside and outside the county, have similar trends as NOAA. I don't care about a one month temperature in your network. I care about the long-term trend. The problem with comparing your average and NOAA. Is that your average is not the County average temperature. Its the average of the group of weather stations. You are making no attempt to match your station network to the characteristics of the county. There are two problems. The older stations are not representative of the county as a whole and the network is changing in time. As illustrated upthread, If the network changes in time a simple average will skew the trend. Your current network appears to be more representative of the county, but that means its a poor match to the older stations. The current network is also largely made up of stations that aren't used for climate analysis. When you can't match the NOAAcounty average or trend, its due in large part to: 1) changes in your station network, 2) other method differences between you and NOAA, and 3) differences in the stations you are using and not due to NOAA's bias adjustments. In any case the bias adjustments for each station are all published. Not sure why you feel a need to overestimate the bias adjustmets and misrepresent their true nature.. The best way to evaluate the bias adjustments that are given to individual stations is to compare the station to other stations in the region. When I do that I don't see a problem with NOAA's adjustments. Phoenxiville, West Chester and Coatesville 1SW all deserve the bias adjustments that I have checked.
-
And you just complained about me cherry-picking one month. For all your complaints, NOAA matches the recent trend at your house closely. How is that? Simple, your house doesn't change from year-to-year. Making your house a much better platform to judge if temperatures are changing with time than a network of stations that is constantly changing.
-
You aren't paying attention. The charts I posted upthread show that Phoenixville ran warm for decades.
-
As usual you are carefully cherry-picking your "facts" to preserve your worldview. Using weather data outside the county makes perfect sense. Weather data is correlated for hundreds of miles and the historic data within the county is very limited. Bottom-line: You don't like NOAA's result; and you'll dismiss/deny any evidence that supports NOAA. As I said above, you live in a different Chester County than I do. The Newark Ag farm is less than 10 miles away from me. I want that data reflected in my climate history. Its just as relevant as any station in Chester County. Not that you couldn't do a better job analyzing the Chester County data by itself. For instance, per chart above, you don't need data from outside the county to bias adjust the Coatesville wartime warm spike. You also don't need any data outside the county to identify the excessive heat at Phoenixville in the 30s, 40s, and 50s, just increases the confidence in doing so. Not surprising that you are way off for Chesco in that period.
-
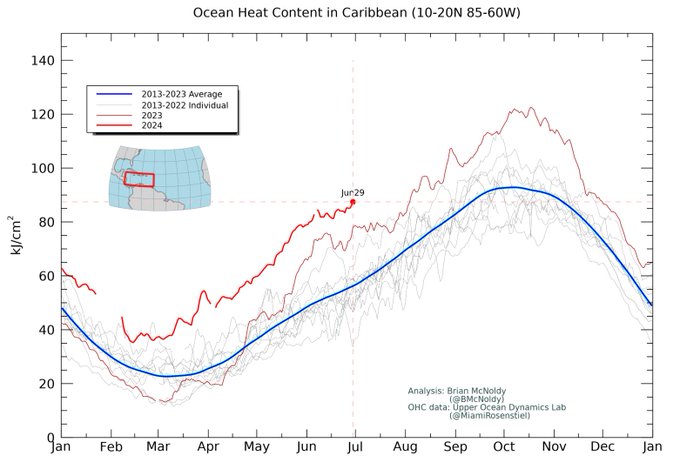
September 10 in Caribbean https://x.com/BMcNoldy/status/1807047443676340225
-
A little surprised by the quote below. This year seems like a close call vs 2023 to me. Its warm this year; but, last year was super warm for a developing nino. "By the end of 2024, global mean temperature will have declined significantly, but the annual 2024 global temperature should readily exceed the prior (2023) record."

-
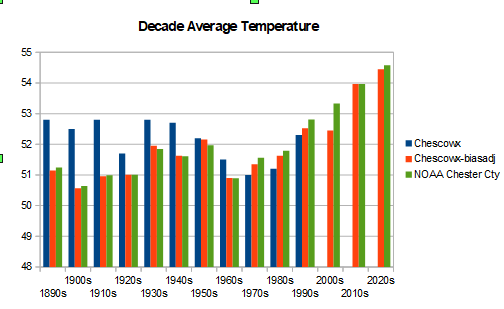
Easy explanation. The older Chesco stations aren't representative of the County as a whole: low elevation, in the warmer part of the county, and they tend to be biased warm; and, in addition, NOAA is using weather stations that are outside of Chester County. NOAA takes advantage of the fact that weather station data is correlated for hundreds of miles. Instead of four stations, tens to hundreds of stations can provide relevant data on Chester County temperatures. Per chart below NOAA has Chester County right where it should be: closer to Allentown than Philadelphia. Note however that Coatesville is very close to NOAA in 1940 and after 1947, further confirming the NOAA the result. In contrast, by just averaging the Chesco stations, you think Chester County is as warm as the Philadelphia Airport or the Newark Delaware Ag farm during the war years. A silly result.
-
No, that's not what I am saying at all. We have plenty of weather stations outside of Chester County to help. The first thing scientists did when stating to develop climate information was investigate how well weather stations were correlated. Turns out they are very well correlated and the correlation extends to roughly 1000 km depending on the region and season. NOAA is looking at much more data when estimating Chester County temperatures and bias adjustments than you are. You are also looking at the adjustments in the wrong way. The adjustments are station-specific and are completely independent of the county average. The adjustments are based in the monthly change in temperature from one year to the next, not on the absolute value. As an example if Phoenixville warms by 1F, while the stations relevant to Phoenixville don't warm, Phoenixville's adjustment will change by 1F reflecting a probable change at the Phoenixville site. The shelter could have been moved for instance. Has nothing to do with the absolute temperature level at Phoenixville, or any other site, or the County average. The county average is only calculated as the last step after all the stations have been bias adjusted, and the individual station values has been mapped to a 5 by 5 km grid covering the entire country. Furthermore Phoenixville, West Chester and Kennett Square are all warmer locations than the county on average due to their location and elevation. Not surprising that they are warmer than the NOAA county average before or after adjustment. The "adjustments" that you are coming up with are much larger than NOAA's, not even close in many cases. You don't understand what NOAA is doing and are way off-base in your criticism.
-
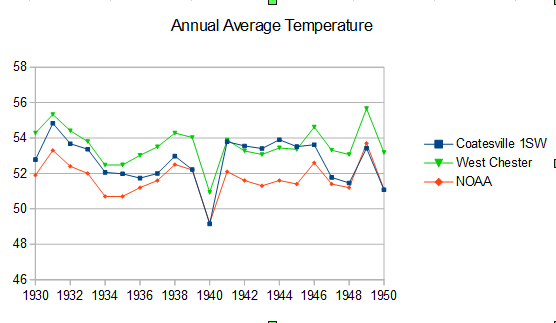
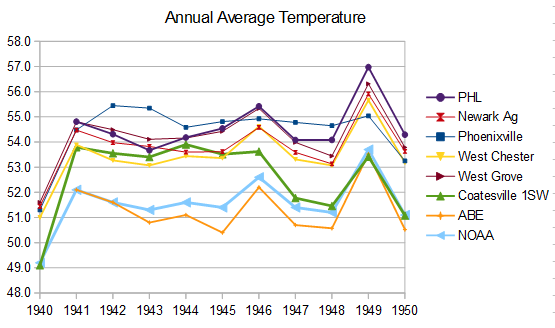
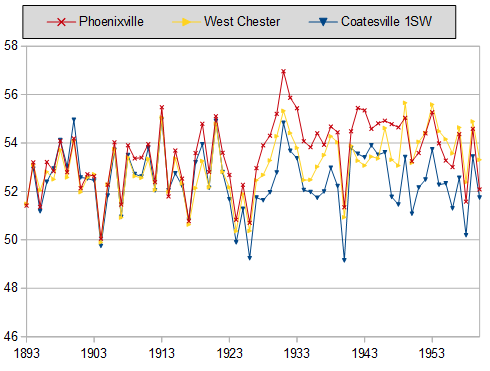
Here are the annual average temperatures for the 3 main historic coop sites in Chester County. Further evidence that Phoenixville ran warm in the mid-20'th century. Not that the other sites don't have potential data inconsistencies. Need to include other stations to fully resolve. When I look at the Chesco coop data I don't see any reason to worry about the NOAA bias adjustments. Every one that I have checked in detail is justified.
-
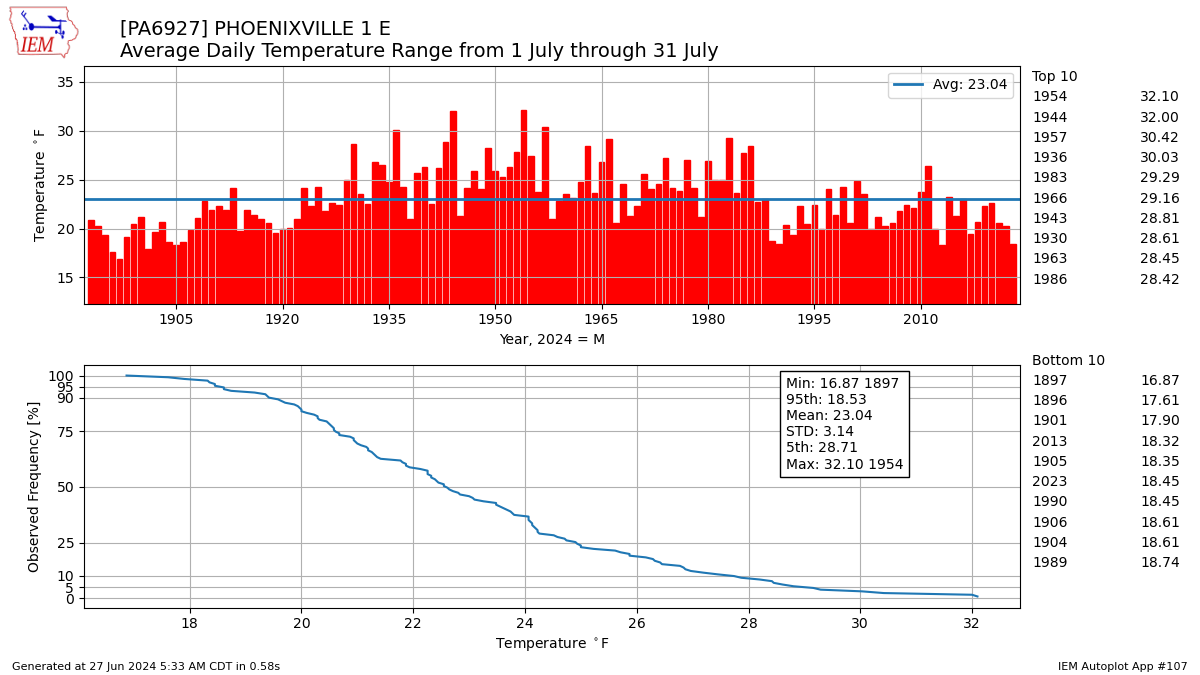
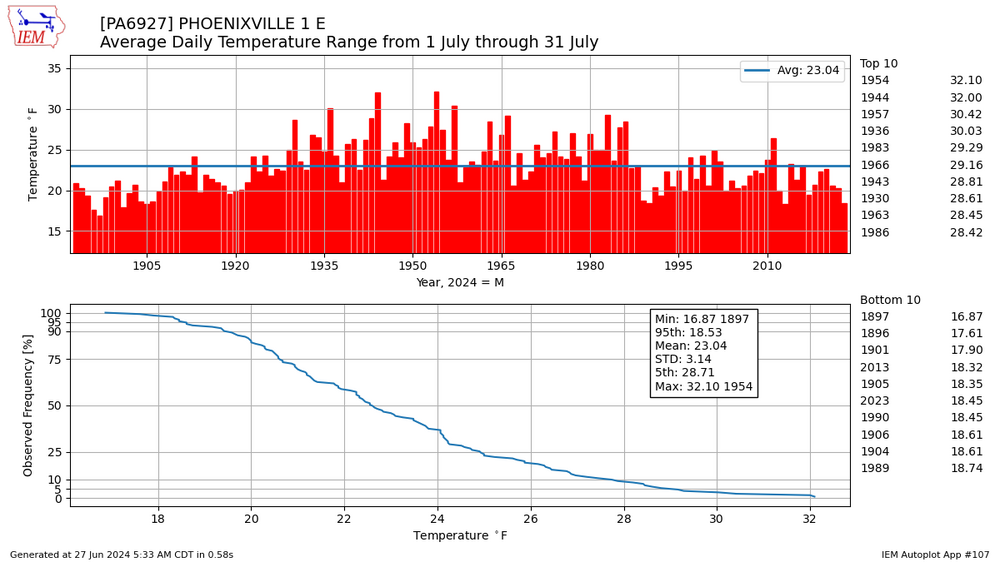
Remember the big spike in 95F days in Phoenixville in the mid-20'th century that didn't occur at other regional sites (posted upthread). Per chart below, the July diurnal temperature range also increased in that period. The increase in diurnal range isn't matched at West Chester or Coatesville. Probably shelter-related as a non-aspirated thermometer will be more prone to shelter problems. Resetting the max/min thermometer in the late afternoon and evening as was the usual practice back in the day would compound the problem. In any case its clear that the raw data need a bias correction.
-
Could be mixing of dryer air from aloft. As the ground warms the depth of mixing increases.
-
Its on a flat earth with a green sky
-
LOL. Weather station data is highly correlated over hundreds of miles. All the stations in Chesco should move the same way. If they don't there is a problem with the measurements or analysis or both. You live in a different Chesco than I do. All I see is steady warming just like the rest of the world. Your own Chescowx data says so.
-
So your whole worldview depends on Chesco not warming. No wonder you ignore all the cracks in the edifice.