chubbs
-
Posts
4,173 -
Joined
-
Last visited
Content Type
Profiles
Blogs
Forums
American Weather
Media Demo
Store
Gallery
Everything posted by chubbs
-
Yes I know what performance is. All the things you mention and more will improve significantly with solid state batteries. The US market doesn't tell you much about EV performance because the best EVs come from China, not the US, and those vehicles are excluded from the US market. However this new announcement may allow other countries to catch-up or even leapfrog China. We will see.
-
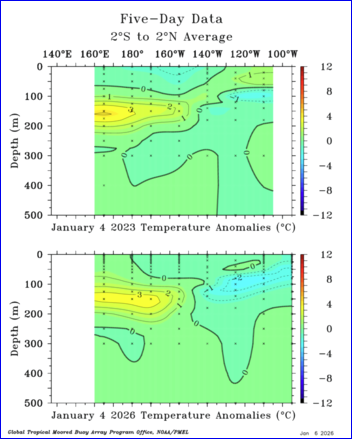
The subsurface temperature distribution in the Pacific is similar to 2023, but the surface is different. Relative warmth is more west-based this year.
-
A Finnish start-up has introduced the first commercial solid-state battery: light-weight, durable, fast charging, and inexpensive. If product claims pan out, EV performance, which is already matching combustion vehicles, will improve dramatically. https://insideevs.com/news/783380/first-production-ready-all-solid-state-battery-official-specs/
-
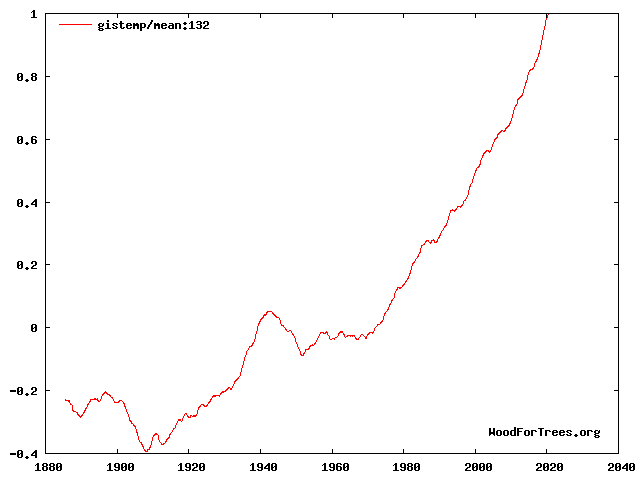
Agree. A global temperature average with an 11-year running mean takes out almost all the variability due to: weather, enso, solar, and volcanoes.
-
Hunga Tonga volcano assessment report is out. Large effect on stratosphere but relatively small effect at surface: Professor Maycock said, "The Report shows that although water vapor is a greenhouse gas, Hunga had a net cooling effect overall and did not cause the record level of global warming observed in 2023 and 2024. This is a very important finding as understanding what caused the recent surge in global warming is a priority for the climate science community." https://phys.org/news/2025-12-international-reveals-atmospheric-impact-hunga.html https://juser.fz-juelich.de/record/1049154/files/Hunga_APARC_Report_full.pdf?version=1
-
Pacific upwelling much faster at the equator than scientists thought “It turns out that equatorial upwelling in the Pacific is about 10 times faster than we previously thought,” Karnauskas said. “And this could be really important because that water rising toward the surface in the Pacific covers a huge fraction of the ocean surface, and it affects things like temperature and nutrients needed for photosynthesis.” His work, published today in the Journal of Climate, reveals the faster rate of upwelling and determines why older estimates were off. Karnauskas combed through old observations and analyzed vast amounts of new data from state-of-the-art measurement tools to get a more accurate estimate. The findings point to a key discrepancy in global climate models, which currently predict significant warming along the equator in the Pacific. This new rate may help researchers understand why they have struggled to capture key climate trends in the region. https://cires.colorado.edu/news/pacific-upwelling-much-faster-equator-scientists-thought https://journals.ametsoc.org/view/journals/clim/38/16/JCLI-D-24-0704.1.xml
-
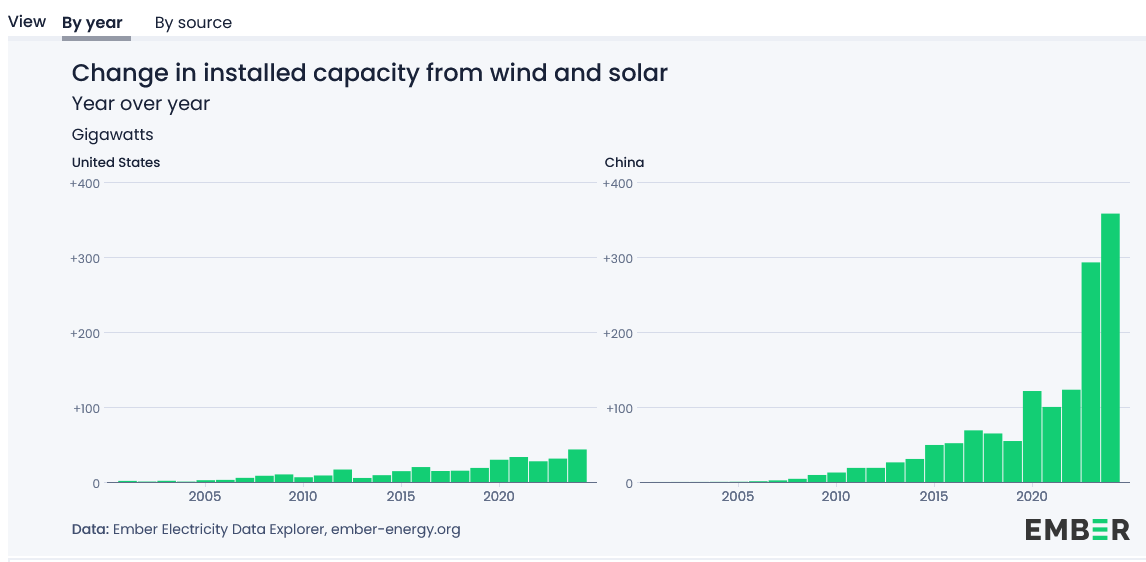
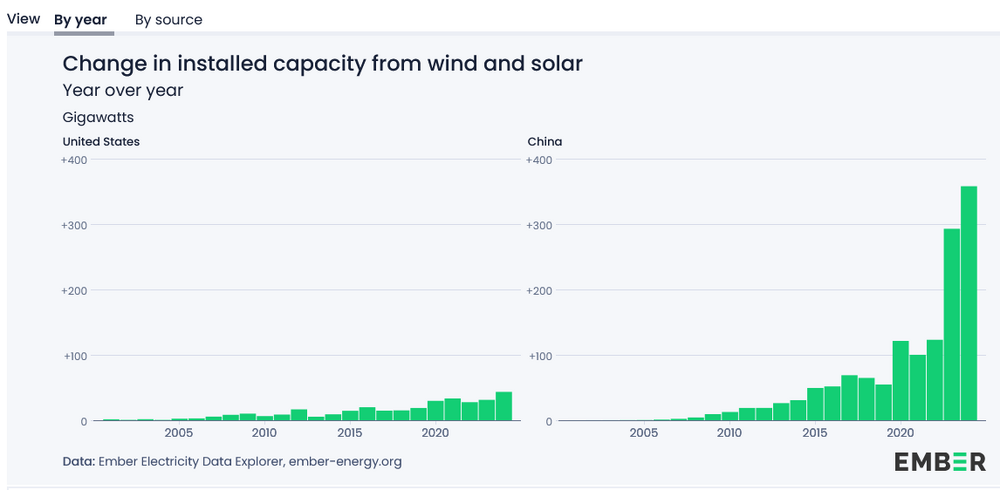
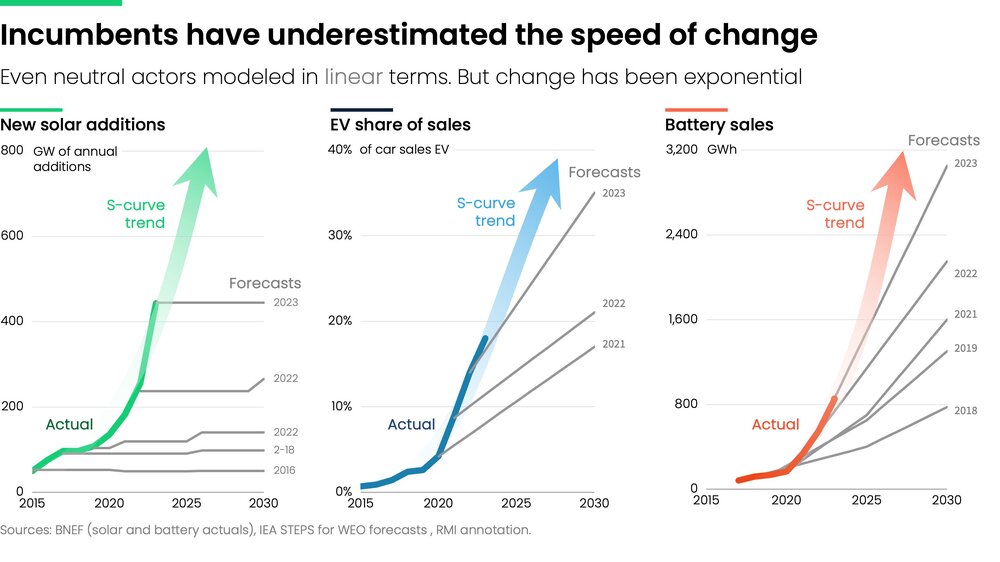
China has shown that it is possible to ramp solar very quickly. The main constraint is factories not resources in the ground like fossil fuels. With batteries dropping rapidly in cost, the addressable market for solar has expanded significantly. The ability to cost-effectively replace fossil fuels at scale has suddenly developed.
-
Below are a press release and a Q+A on the retracted paper. The problems with the original paper have been addressed and a new paper has been submitted. How do the results in the corrected version compare to the original: "The revisions did not significantly alter the central estimates, but did increase the uncertainty range they sat within. Correcting the underlying data for Uzbekistan and introducing additional controls to make the model more robust to outlier data and anomalies resulting from the transition between data sources changed the global median income loss from 19% (18.8%) to 17% (17.4%). Accounting for spatial correlation using ‘Conley standard errors’ did not affect the median, but did increase the uncertainty ranges, with the likely range of damages by mid-century increasing from 11-29% to 6-31%." https://www.pik-potsdam.de/en/news/latest-news/authors-retract-nature-study-on-economic-damages-from-climate-change-will-resubmit-for-peer-review https://www.pik-potsdam.de/en/news/latest-news/questions-and-answers-nature-study
-
Northern Hemi snow has also been running low for most of the cold season, record low at times. This can shift quickly. Currently Eurasia is very low, while N America is above average with recent snow advance.

-
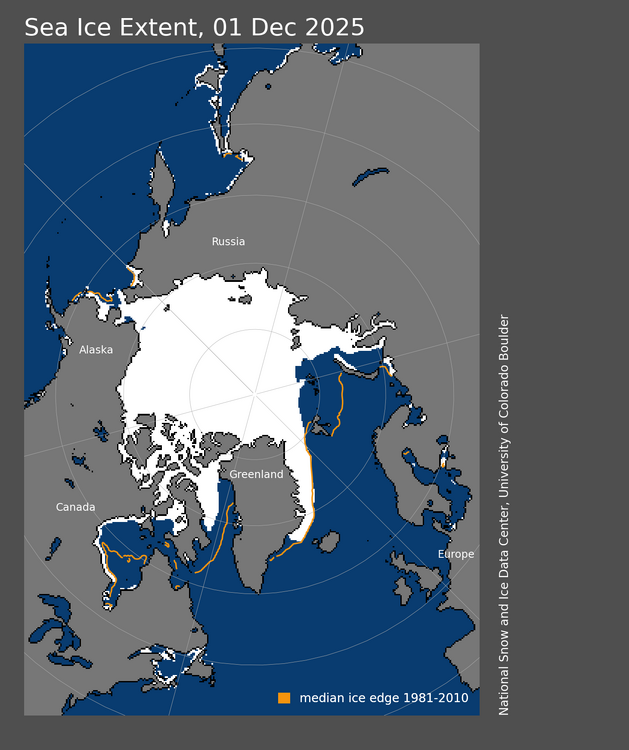
Sea ice is close to normal on the Pacific side; but well below normal on the Atlantic side and Canada.
-
e Its not surprising that EV use is progressing unevenly. Transition costs for charging and other infrastructure is high. Subsidization varies. The key for EVs is battery technology which is proceeding rapidly: different lithium chemistries, sodium, and solid state. These new technologies have: lower cost, better safety, faster charging, longer battery life etc. EVs are getting better and cheaper. Now that EVs are becoming as cheap as combustion cars subsidies are becoming less important. The genie is out of the bottle. With the withdrawal of policy suppport, the US will lag; but, global penetration will continue to ramp quickly. EVs are very attractive to countries that import oil.
-
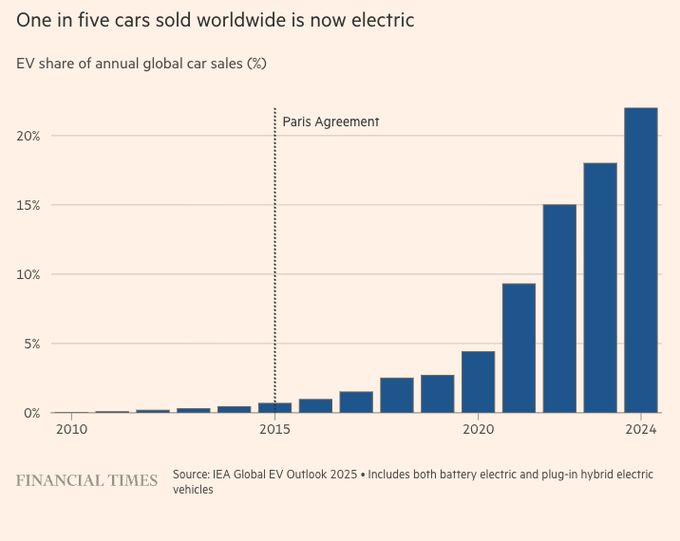
The chart I posted has global numbers. The US is lagging. We have large import duties on solar, and EVs from China making our costs higher than the rest of the world.
-
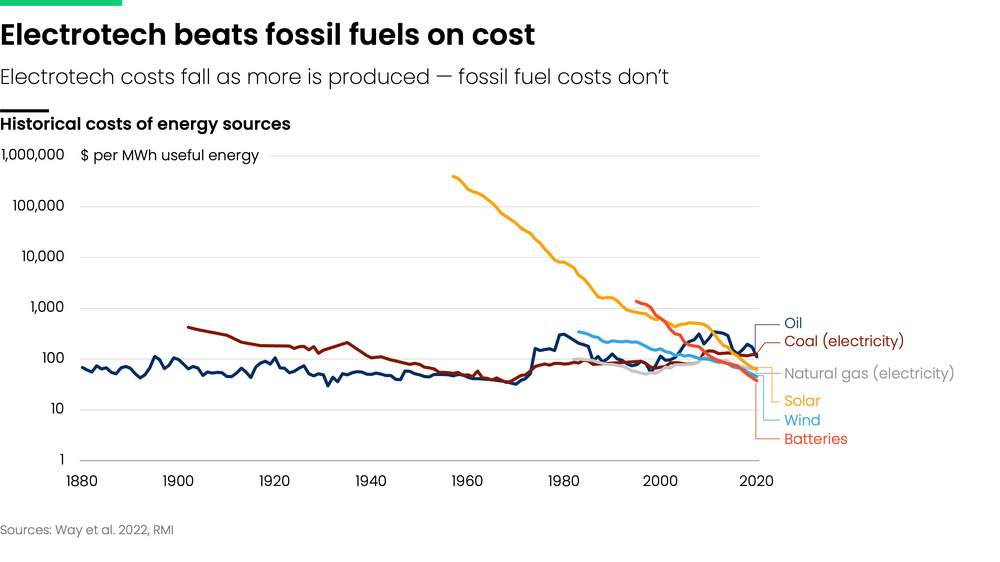
Don't agree. Renewables are manufacturing technologies, like TVs or cellphones, and get cheaper as cumulative production increases. Subsidization was necessary and worthwhile while renewable cost was higher. The cost of the subsidies is minor vs the long-term benefits of sustainable, abundant, cheap and carbon-free energy. China has provided the largest subsidies and is reaping the largest benefits. We should have subsidized more not less. Renewables have already caught up with fossil fuels in cost and will only get better with time. The transition to renewables is accelerating and will take decades, not centuries. Its inevitable now that renewable costs are lower than fossil fuels. https://electrotechrevolution.substack.com/p/rewiring-the-energy-debate?utm_source=substack&utm_campaign=post_embed&utm_medium=web
-
Environmental impacts are a cost to society. Fossil fuels have been and largely still are getting a free ride on CO2 emissions. The typical coal or gas-fired power plant doesn't pay for its CO2 emissions. A big subsidy.
-
The plants that were being shutdown had relatively high cost, that's why they were being shutdown.
-
Long article on rapid introduction of electric HD trucks in China. China is upending fossil fuel economics: "The lesson for Western operators and policymakers is that the cost curve has shifted. The decisions that made sense even in 2024 do not match the realities of 2025." https://cleantechnica.com/2025/11/26/chinas-bev-trucks-and-the-end-of-diesels-dominance/
-
Don't agree with your comments. The article provided references. Other than fully depreciated gas and nuclear, Renewables are the lowest cost of electricity in the US. New gas plants, to meet increasing demand, will be much more expensive than fully depreciated; and, as the article states, costs and backlogs for new gas plants are increasing.
-
Data is available at link below. Glad to answer questions. https://ceres-tool.larc.nasa.gov/ord-tool/jsp/EBAFTOA421Selection.jsp
-
Ceres has updated through September. Net radiation continues to increase off the enso bottom and the 12-month average is getting close to peak levels in La Ninas before 2020.

-
Slowing down the introduction of renewables is going to increase US electricity prices. https://www.forbes.com/sites/ianpalmer/2025/11/23/electricity-prices-will-shoot-up-due-to-us-federal-mandates/?ctpv=xlrecirc
-
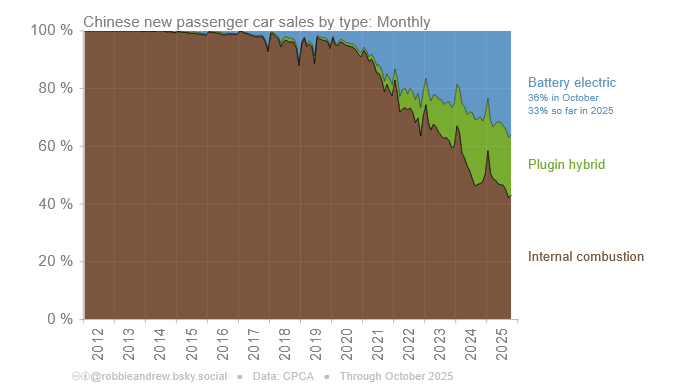
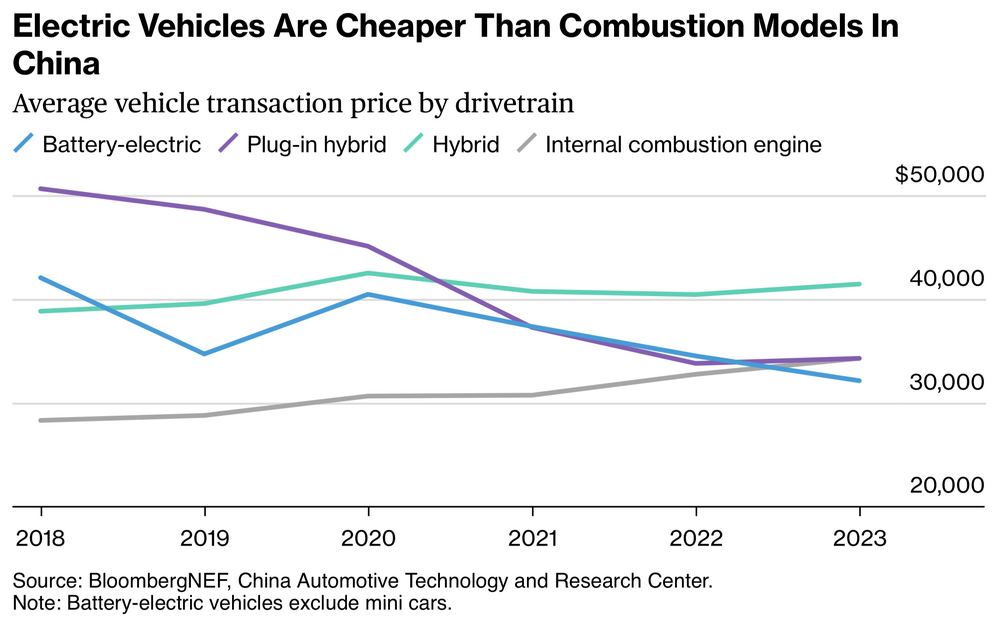
Plug-in hybrids, EVs with a back-up gas engine, are an additional roughly 20% in China. So conventional combustion cars have fallen below 50%. EV subsidies are being eliminated in China as they aren't needed anymore (see link). Agree China wouldn't have cheap EVs without subsidies. However, now that cheap EVS are here there is no going back. EVs are only going to get cheaper and better going forward as commercial scale increases and battery technology improves. China's big EV bet is paying off. Their EV exports are ramping, reaching a record $7 billion in August. (2nd link). https://www.reuters.com/business/autos-transportation/china-signals-it-will-pull-plug-subsidies-evs-with-five-year-plan-exclusion-2025-10-29/ https://ember-energy.org/data/china-cleantech-exports-data-explorer/
-
Agree that EV's are not out competing oil in the US. They are outcompeting in China though, and those cars will spread as volume production increases both in China and in plants being built by Chinese companies around the world.
-
A number of countries have increasing EV market share with the global share over 20% this year. Link below has EV and plug-in EV market penetration for 61 countries. There's a range between countries with the US and North America a relative low penetration area. Another growing EV market is Heavy-Duty trucks, which are ramping quickly in China (2nd link), reaching a 28% market share there in Aug 25. https://robbieandrew.github.io/carsales/ https://apnews.com/article/china-truck-lng-ev-diesel-transport-70f3d612de4b45b6f954a7f557f7f741
-
Yea he brought up some good points: our economy and life-style is currently dependent on oil, and oil is running out. However. he's wrong that there is no alternative. Electric vehicles are out competing combustion vehicles in an increasing number of markets and getting cheaper all the time. Meanwhile the best oil reserves are increasingly depleted. Its not going to get better for oil.
-
Believe the table is calculating electric energy out vs fossil energy in over the powerplant lifetime; i.e., coal (or gas, oil) used to generate power is included. Fossil fuel use during operation of the wind turbine is also included. Agree that society gets an energy payback from use of coal or oil. The problem is that once burned the coal it is gone forever. In-any-case wind has a good energy payback. Here's an extensive study from Europe covering 33 different kinds of turbines. The median payback period is 6 months. Note that the energy payback for wind has to be good. Its the cheapest source of electricity in windy areas like the great plains. If it didn't pay back it wouldn't be cheap. https://www.sciencedirect.com/science/article/abs/pii/S0196890421005100