RIC Airport
-
Posts
2,586 -
Joined
-
Last visited
Content Type
Profiles
Blogs
Forums
American Weather
Media Demo
Store
Gallery
Everything posted by RIC Airport
-
Richmond Metro/Hampton Roads Area Discussion
RIC Airport replied to RIC Airport's topic in Mid Atlantic
Not sure that is done, I'll refresh and update in a few. -
Richmond Metro/Hampton Roads Area Discussion
RIC Airport replied to RIC Airport's topic in Mid Atlantic
-
Richmond Metro/Hampton Roads Area Discussion
RIC Airport replied to RIC Airport's topic in Mid Atlantic
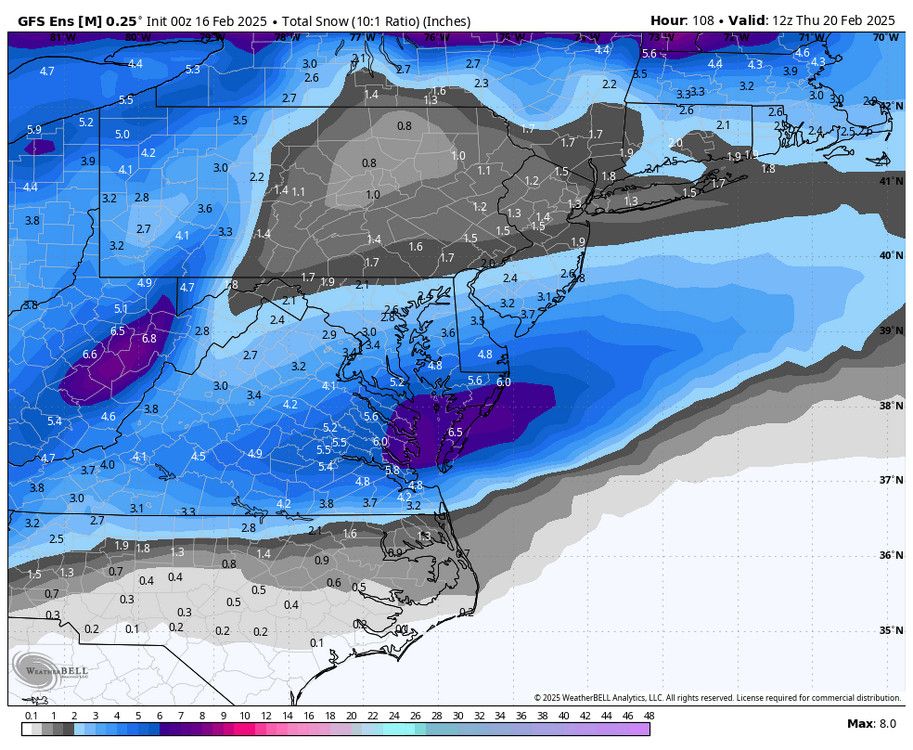
00z GEFS coming in slightly better, fwiw. -
Richmond Metro/Hampton Roads Area Discussion
RIC Airport replied to RIC Airport's topic in Mid Atlantic
CMC loves Hampton Roads, @chris624wx, @ldub23 @EverythingisEverything.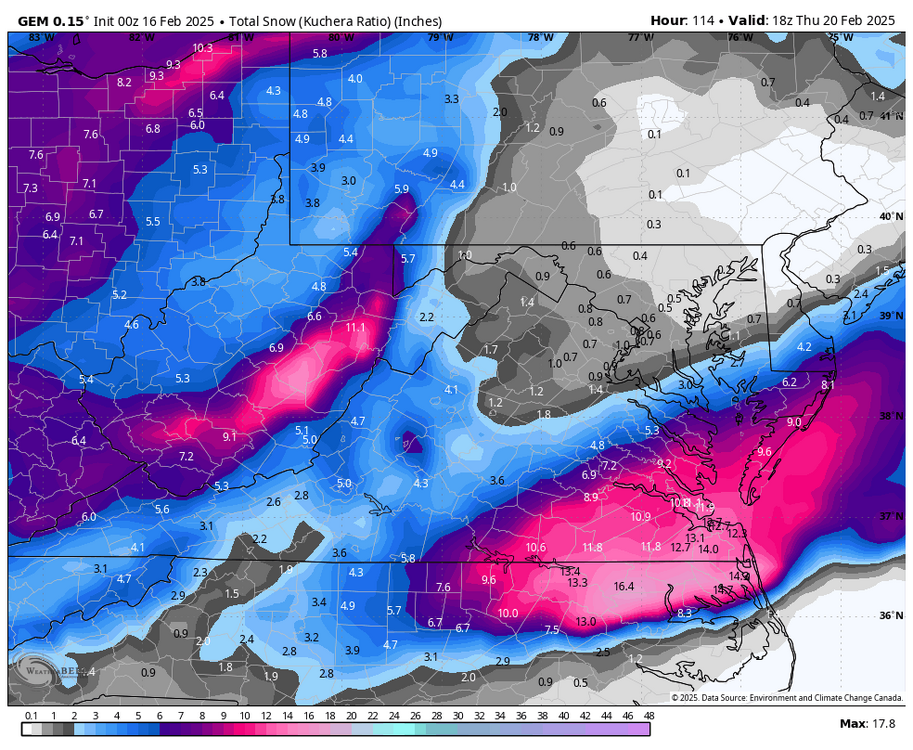
-
Richmond Metro/Hampton Roads Area Discussion
RIC Airport replied to RIC Airport's topic in Mid Atlantic
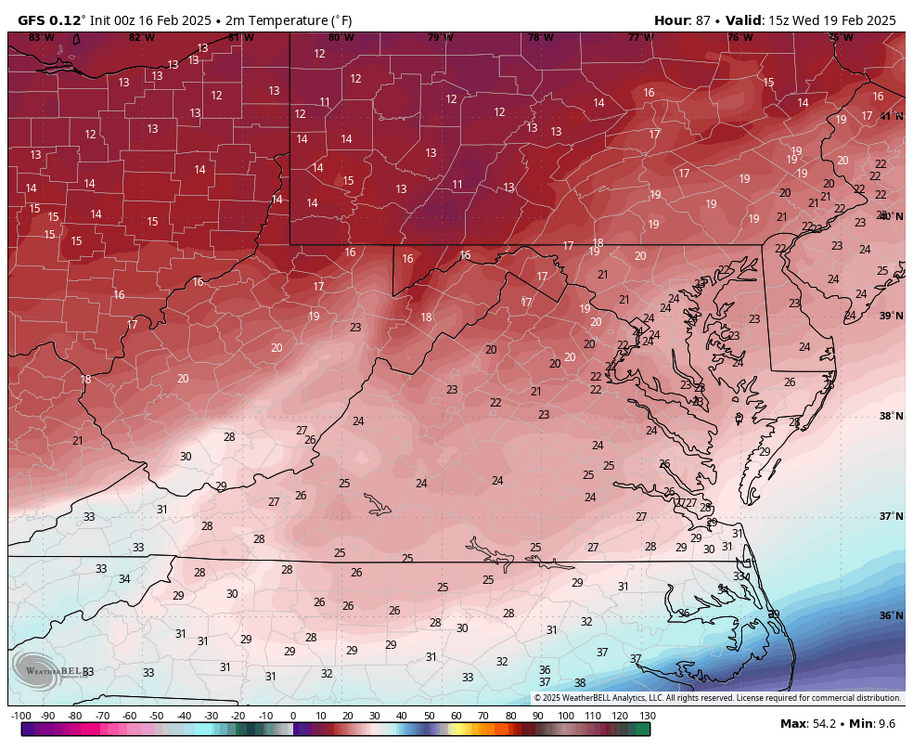
No worries, I'm not really liking the dryer trend. But, ratios should be cold with these temps.

-
Richmond Metro/Hampton Roads Area Discussion
RIC Airport replied to RIC Airport's topic in Mid Atlantic
-
Richmond Metro/Hampton Roads Area Discussion
RIC Airport replied to RIC Airport's topic in Mid Atlantic
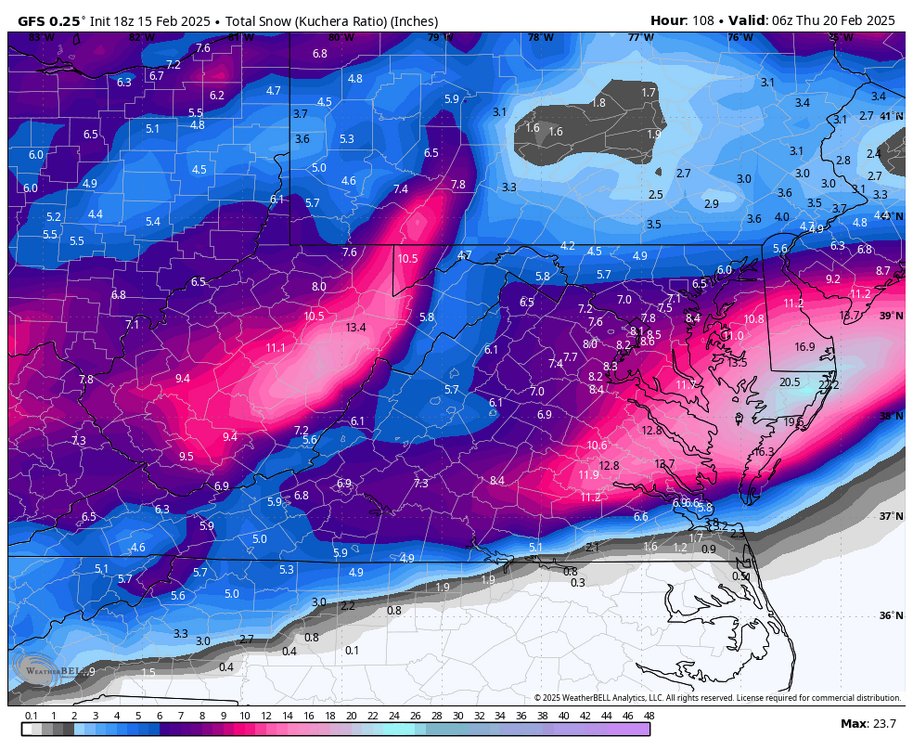
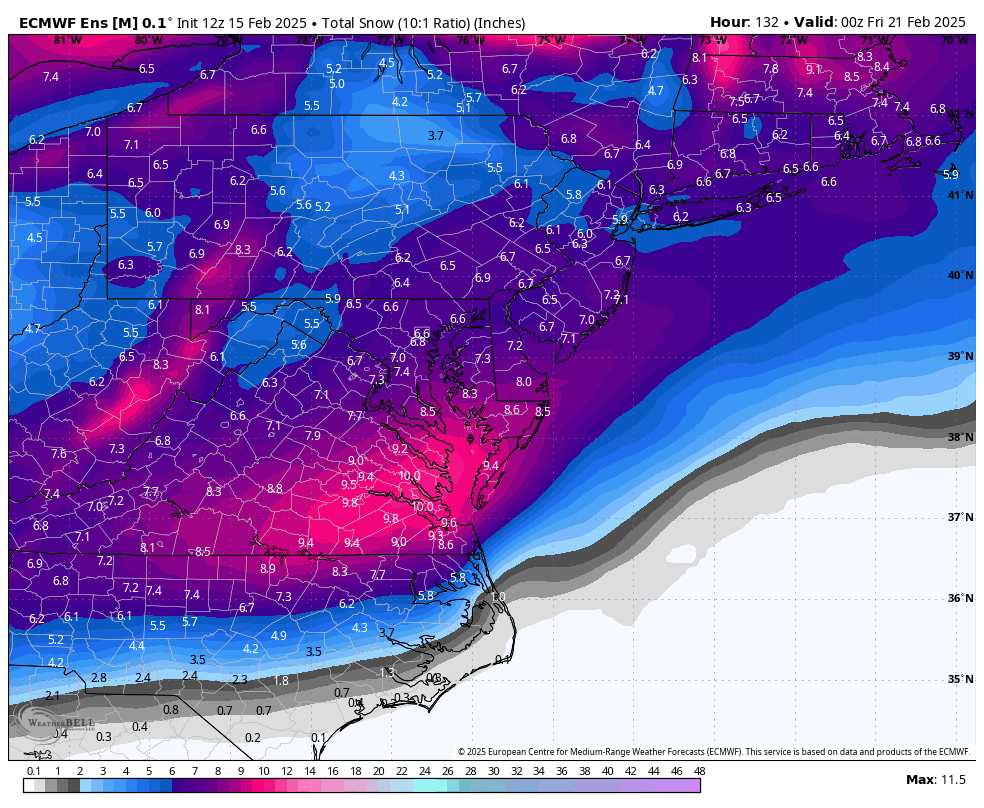
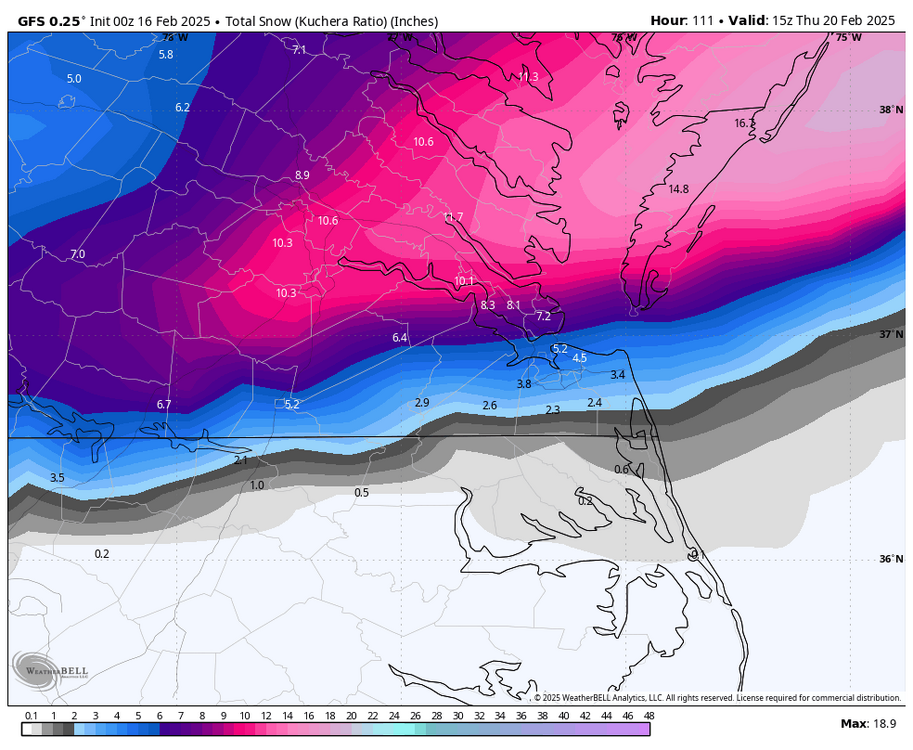
If I were forecasting for RIC, I think 6-10" is probably a good call now. I'd be cautious forecasting more than that because over the last 30 or so years, somewhere between 6-12" has always seemed to be the cutoff in storms with this set up, while just to the north and west of metro Richmond, we more often saw 12-18"+ totals. The models had massive totals leading up to the events below, but they still fell short of expectations because of either mixing or dry slotting. Richmond Airport totals in () January 2016 (11.4") February 2014 (5.8" February 2010 (6.6") December 2009 (7.4") February 2003 (1.9")--IP/ZR storm January 1996 (12.0") Since it's been so long, I would love to see a top 10 storm (12.7"+) at the airport. Hopefully, this event will finally deliver the big one for the airport to get something updated in the record books. -
Richmond Metro/Hampton Roads Area Discussion
RIC Airport replied to RIC Airport's topic in Mid Atlantic
Outside of a few clown maps at 300+ hours, yes, this is the most legit since 2018 for most areas east of the blue ridge and south of Fredericksburg. There were a few large totals on some runs in January 2022, but that was short lived. -
Richmond Metro/Hampton Roads Area Discussion
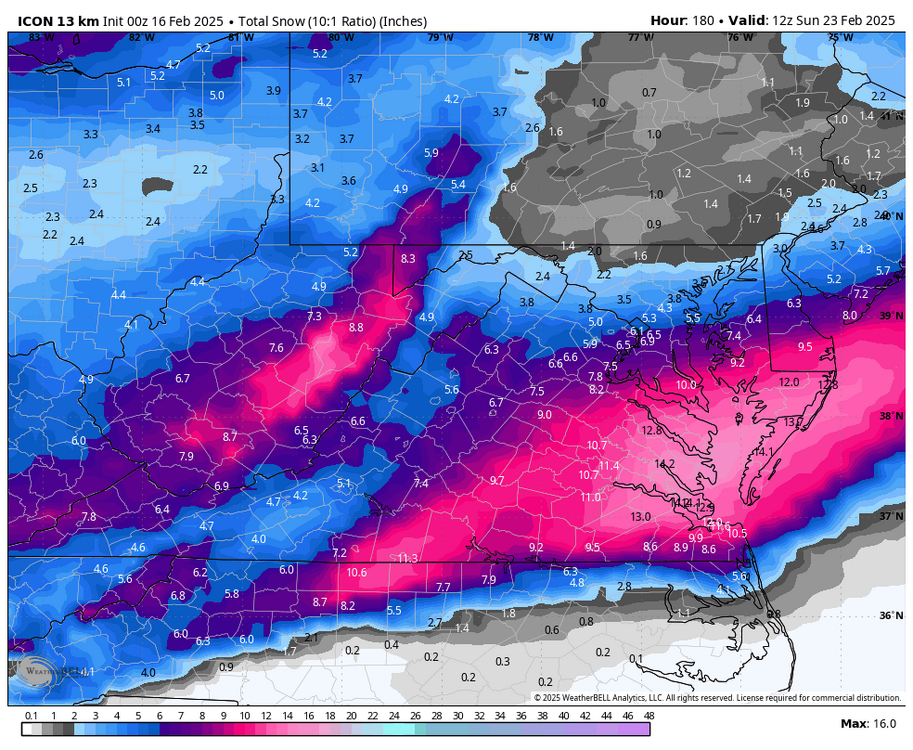
RIC Airport replied to RIC Airport's topic in Mid Atlantic
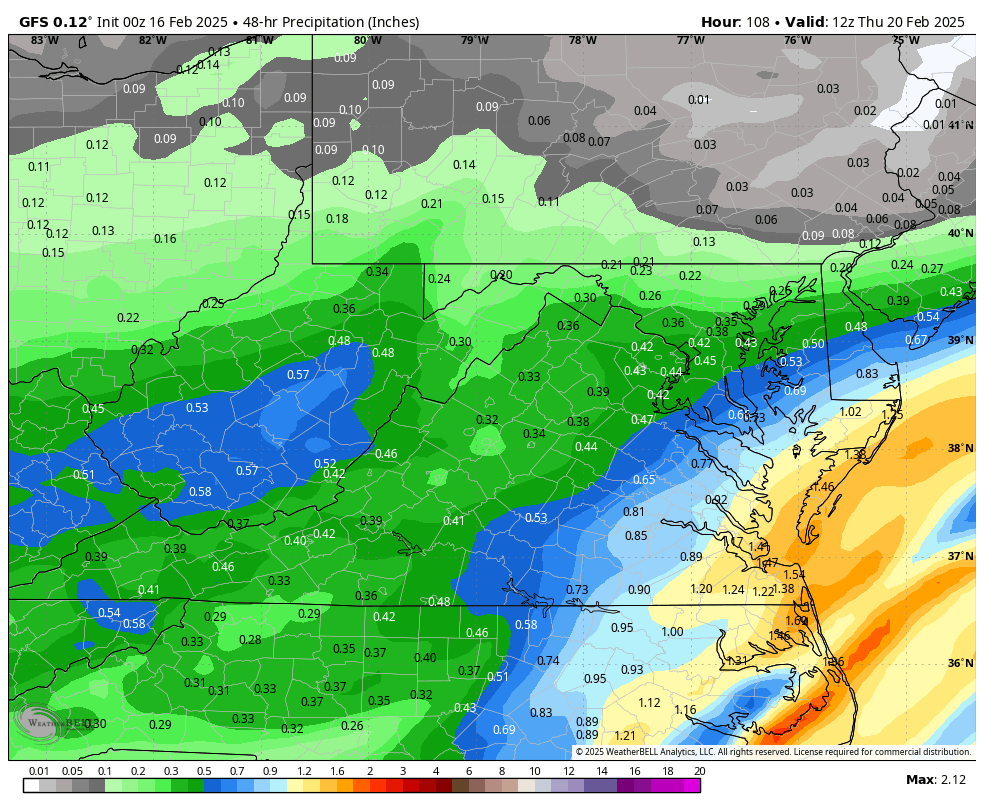
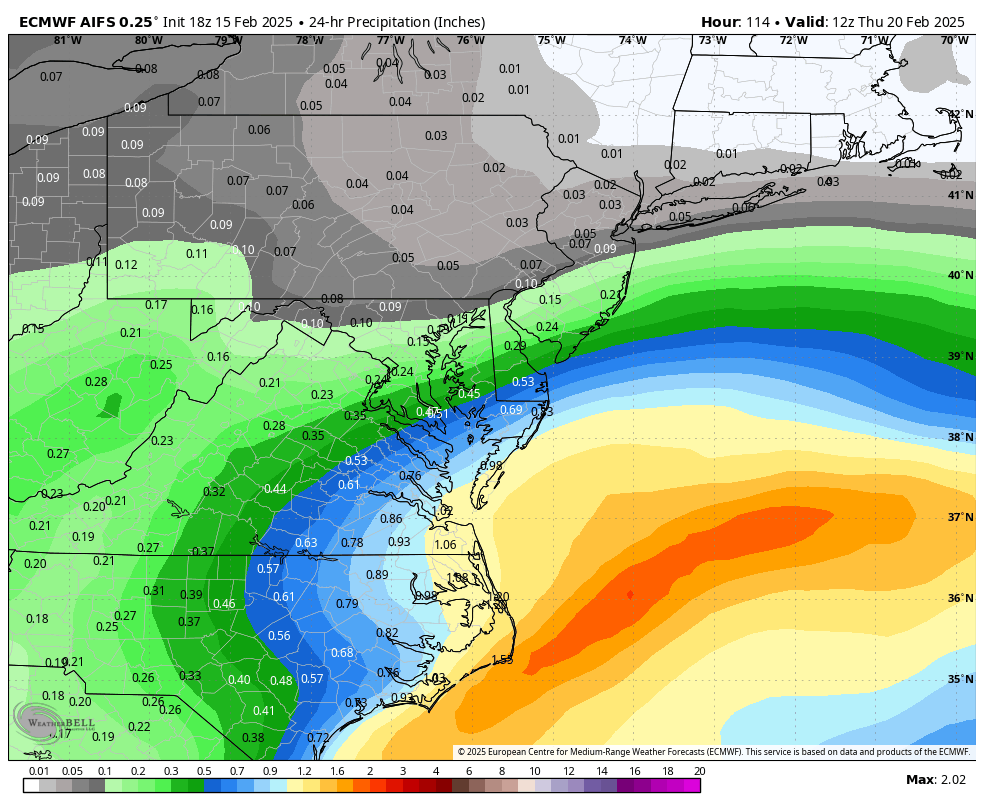
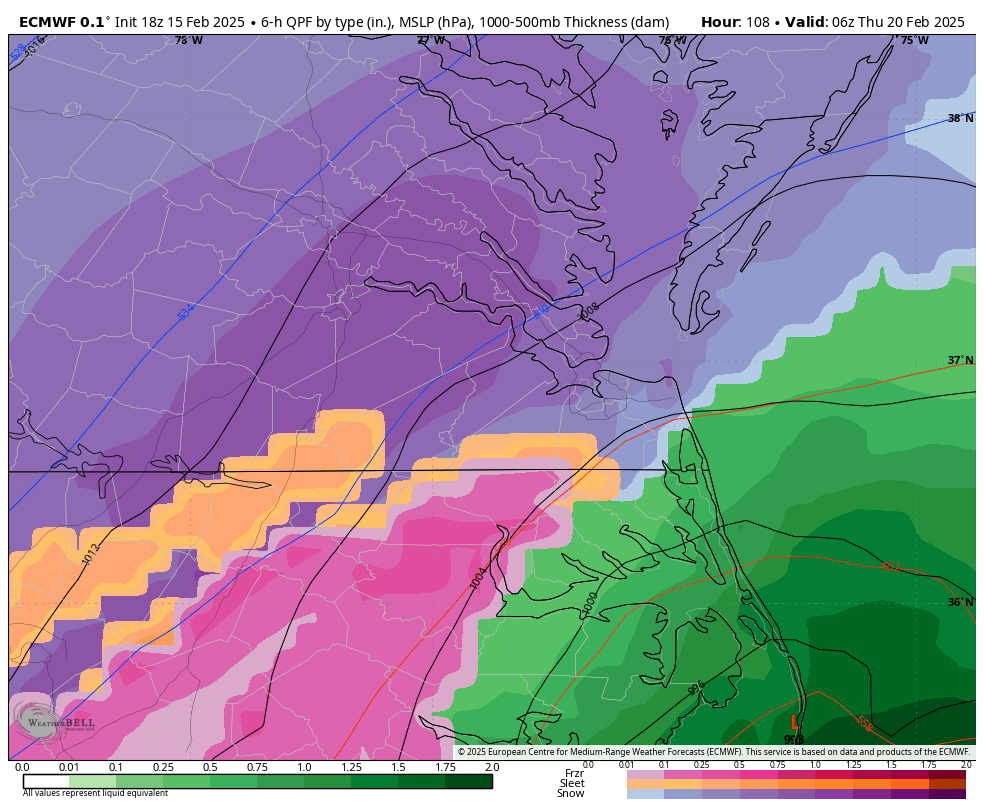
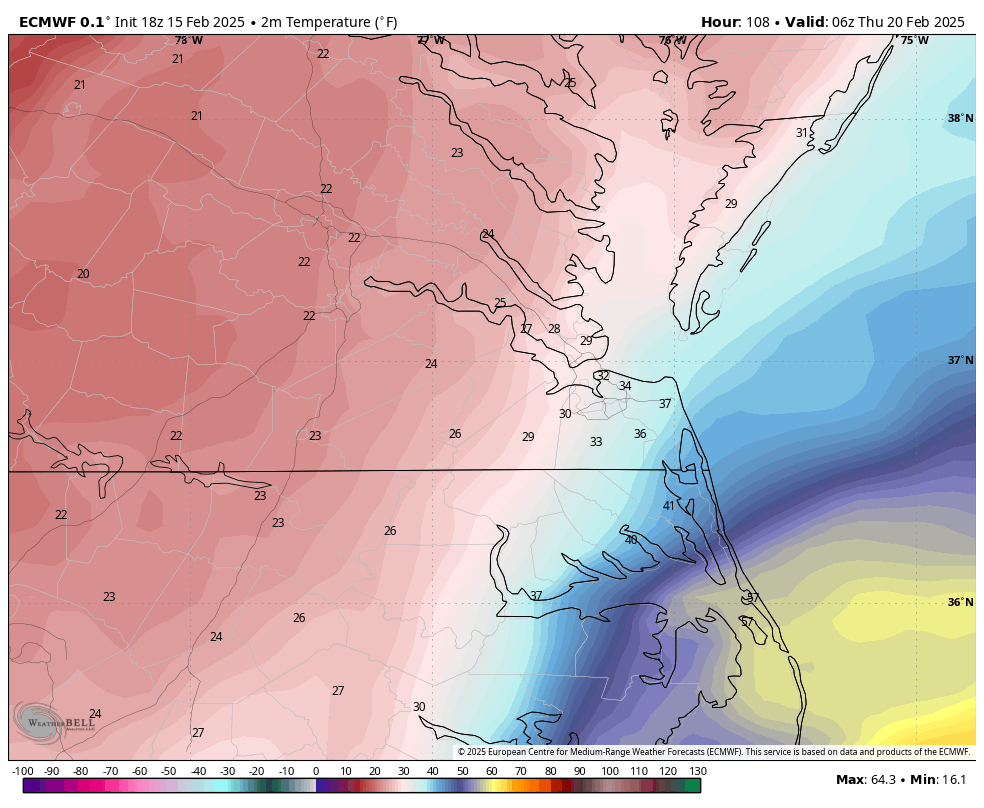
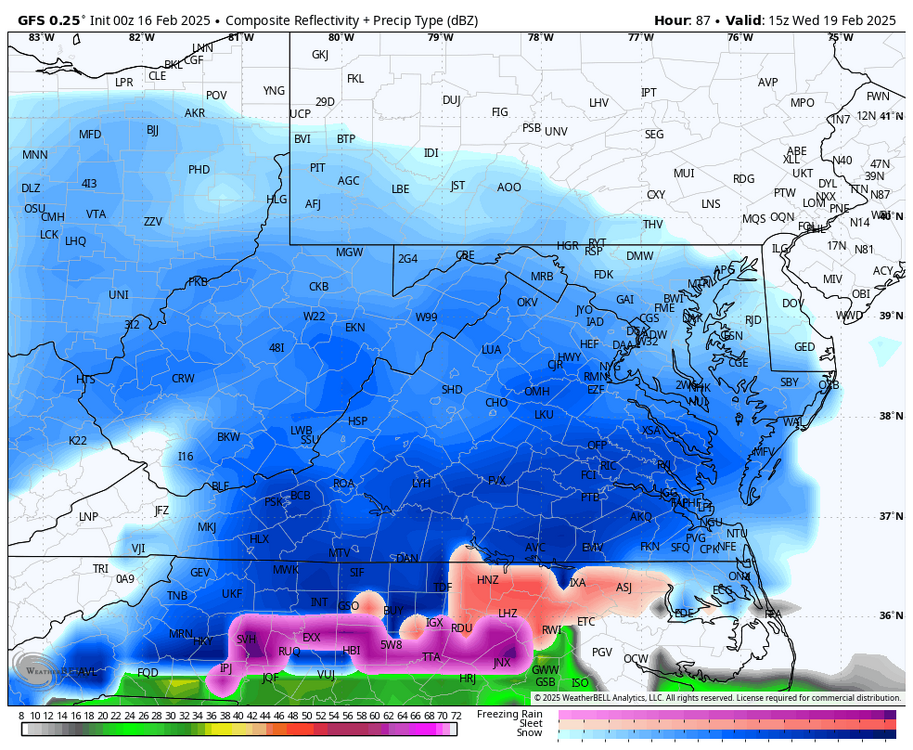
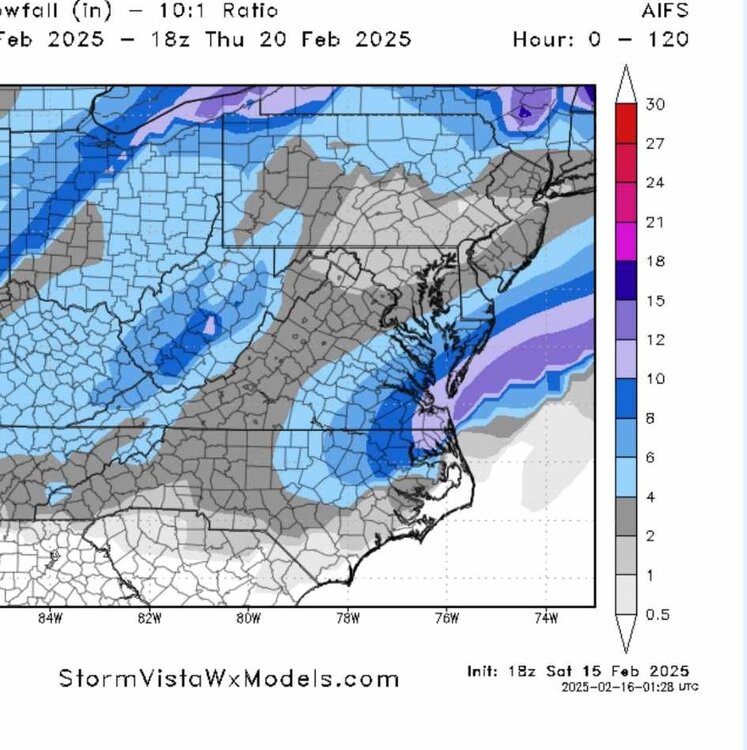
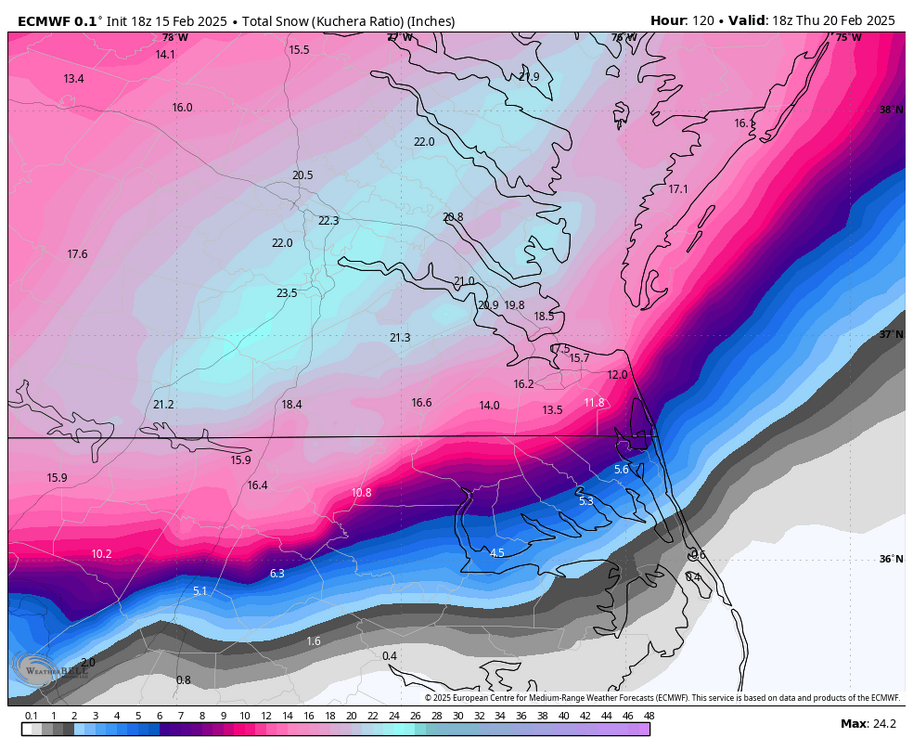
Ratios would be higher given how cold the temps are with 1"+ QPF.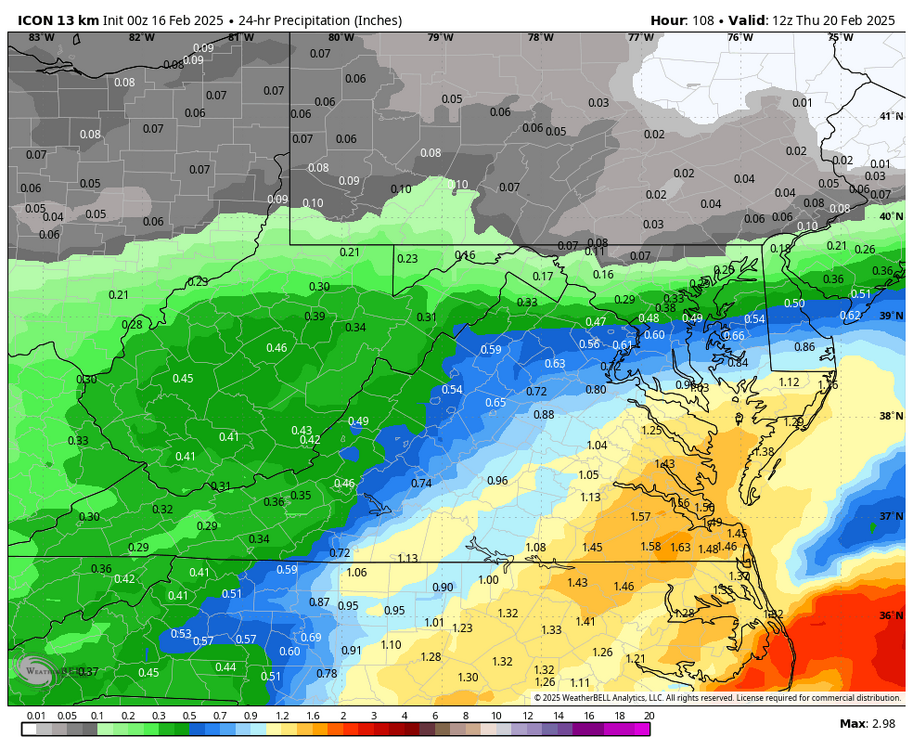
.thumb.png.2ed708f73382cd559fcca6bbf7c7e28b.png)
-
Richmond Metro/Hampton Roads Area Discussion
RIC Airport replied to RIC Airport's topic in Mid Atlantic
Btw, Kuchera isn’t available on Wxbell for the ICON. -
Richmond Metro/Hampton Roads Area Discussion
RIC Airport replied to RIC Airport's topic in Mid Atlantic
-
Richmond Metro/Hampton Roads Area Discussion
RIC Airport replied to RIC Airport's topic in Mid Atlantic
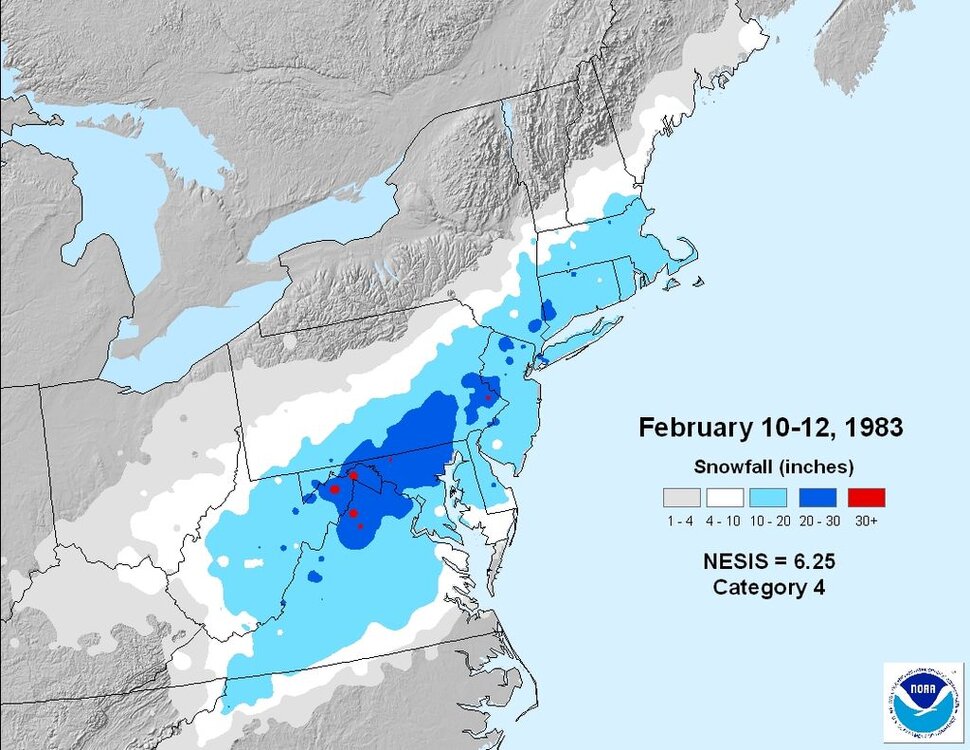
I did see 1983 as a 500mb height analog on a WPC chart yesterday. Not sure if this storm is exactly the same, the 1983 was a primary that formed in the gulf and came up the coast. (see animation below) RIC: 17.7" DCA: 16.6" ORF: 1.1"
-
Richmond Metro/Hampton Roads Area Discussion
RIC Airport replied to RIC Airport's topic in Mid Atlantic
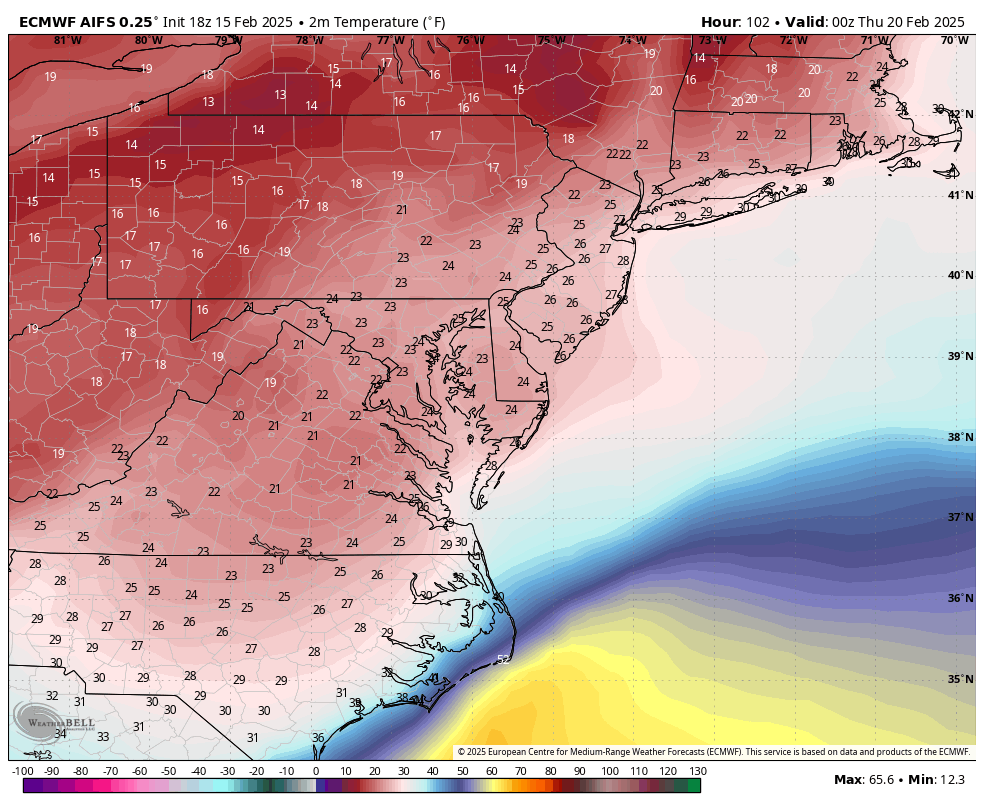
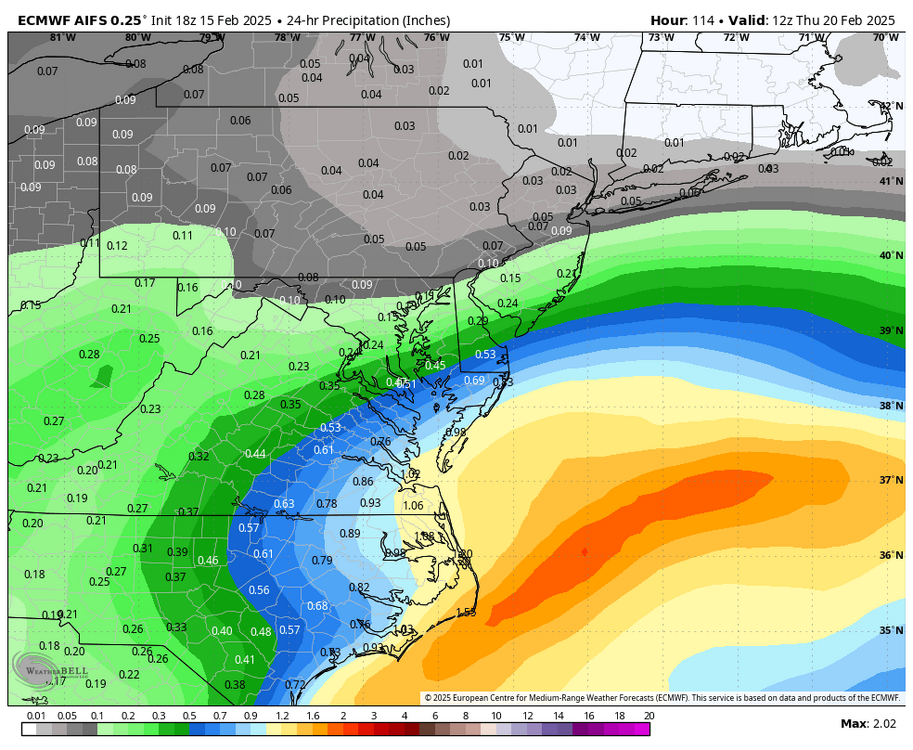
I always remain cautious until about 36 hours out as so much can still go wrong. Will be interesting to see what the 00z suite does, hopefully we won't see it weaker, farther east. Hard to get much better than today's 18z Euro run, at least for our region. However, if the 18z Euro AI is to be believed, Hampton Roads is the real winner.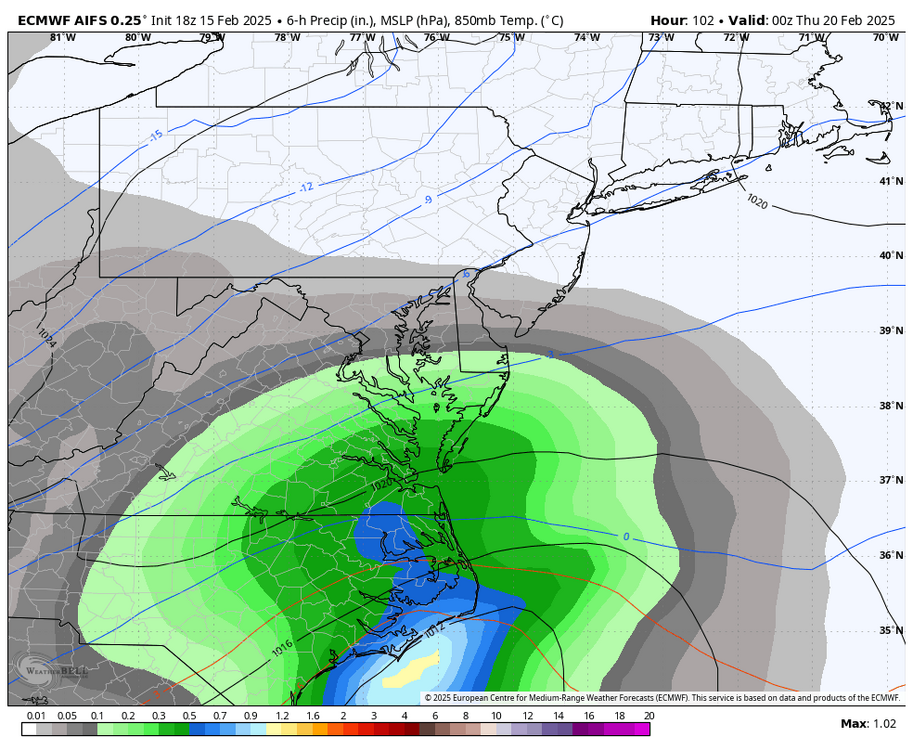

-
Richmond Metro/Hampton Roads Area Discussion
RIC Airport replied to RIC Airport's topic in Mid Atlantic
-
I would double check the dates, I don't recognize a few of them like 4/5/1980.
-
Richmond Metro/Hampton Roads Area Discussion
RIC Airport replied to RIC Airport's topic in Mid Atlantic
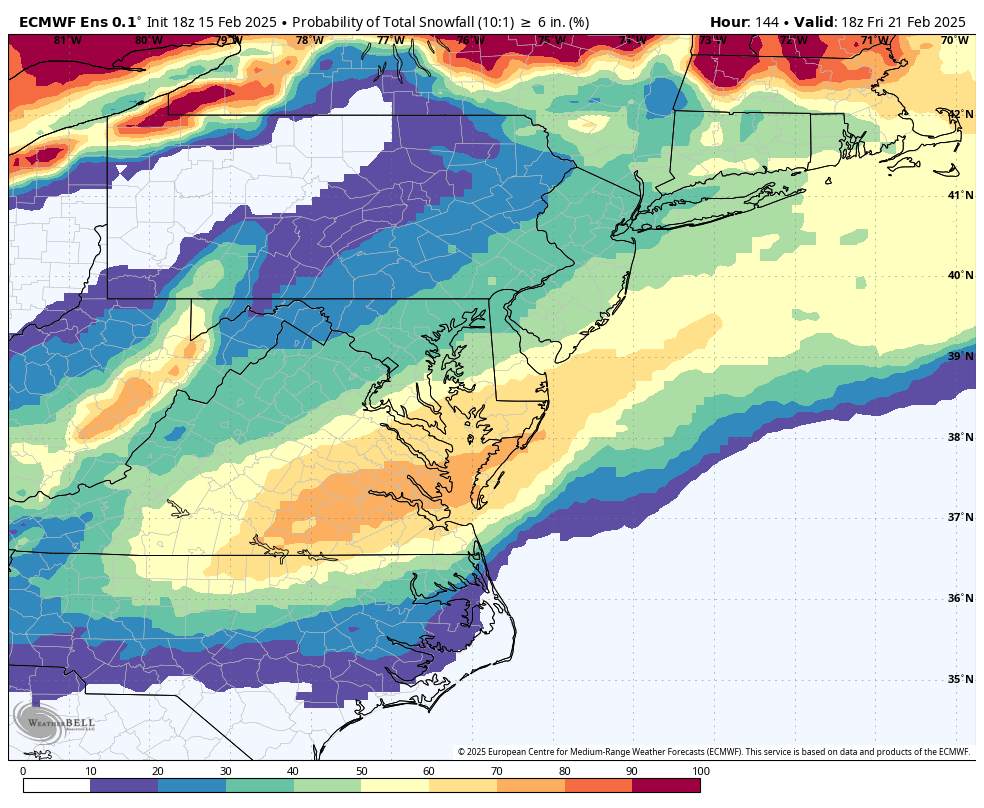
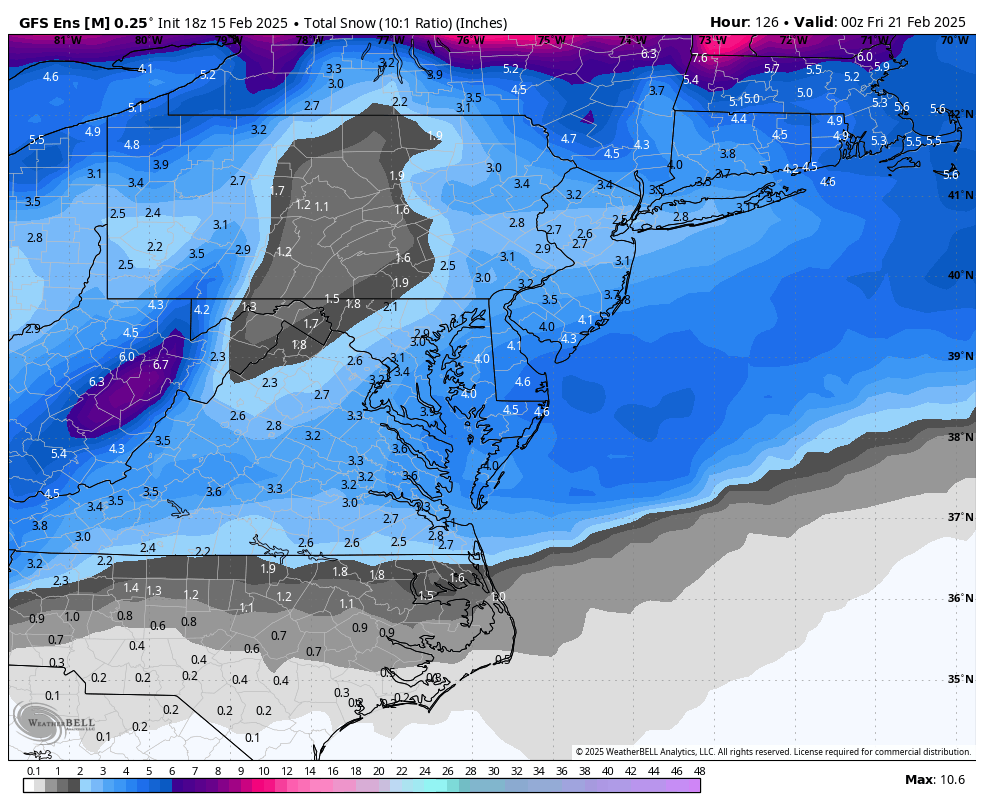
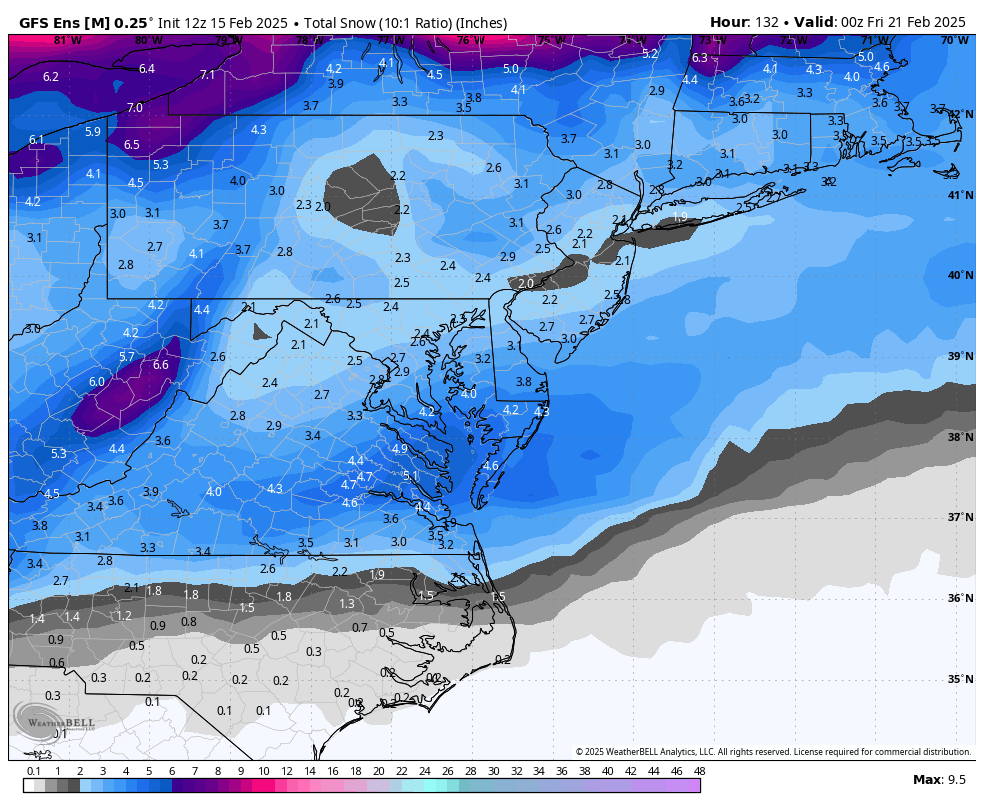
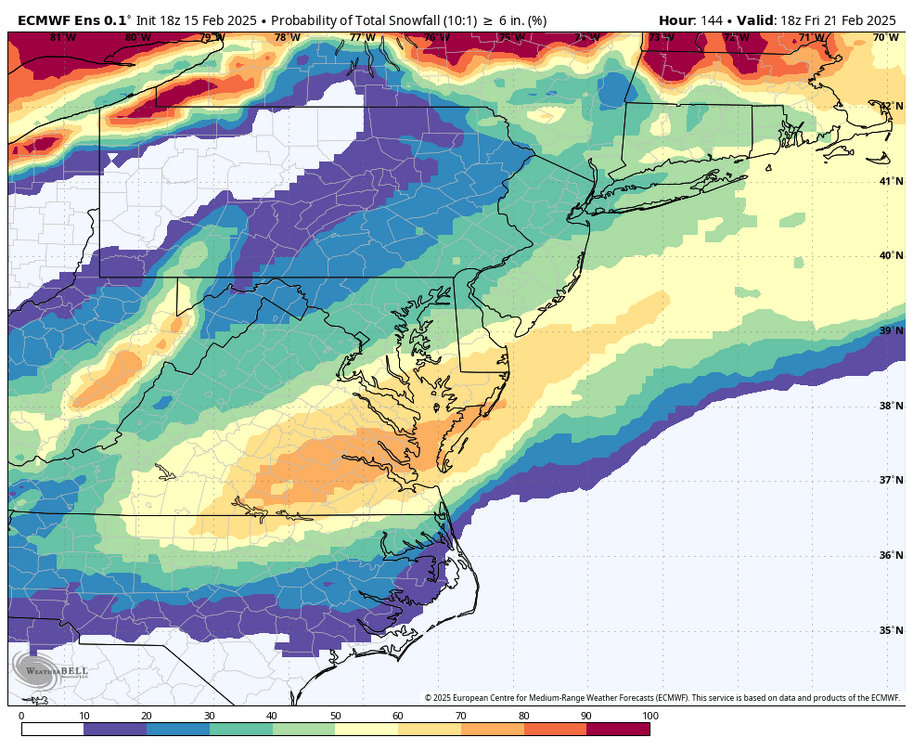
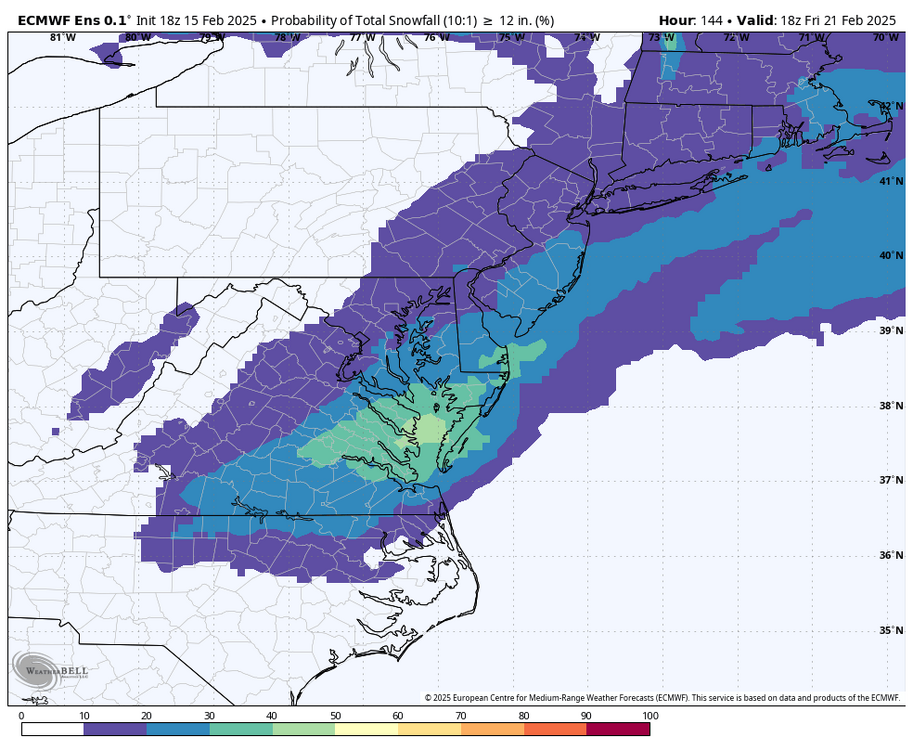
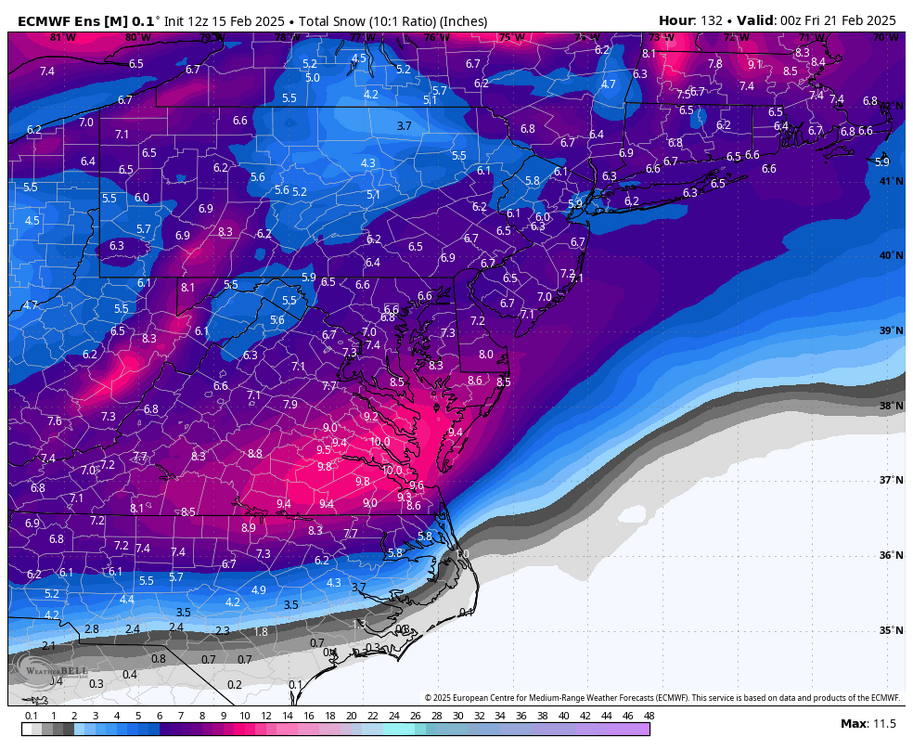
18Z EPS very similar to the 12z EPS (2nd map below) with the axis of heaviest snows.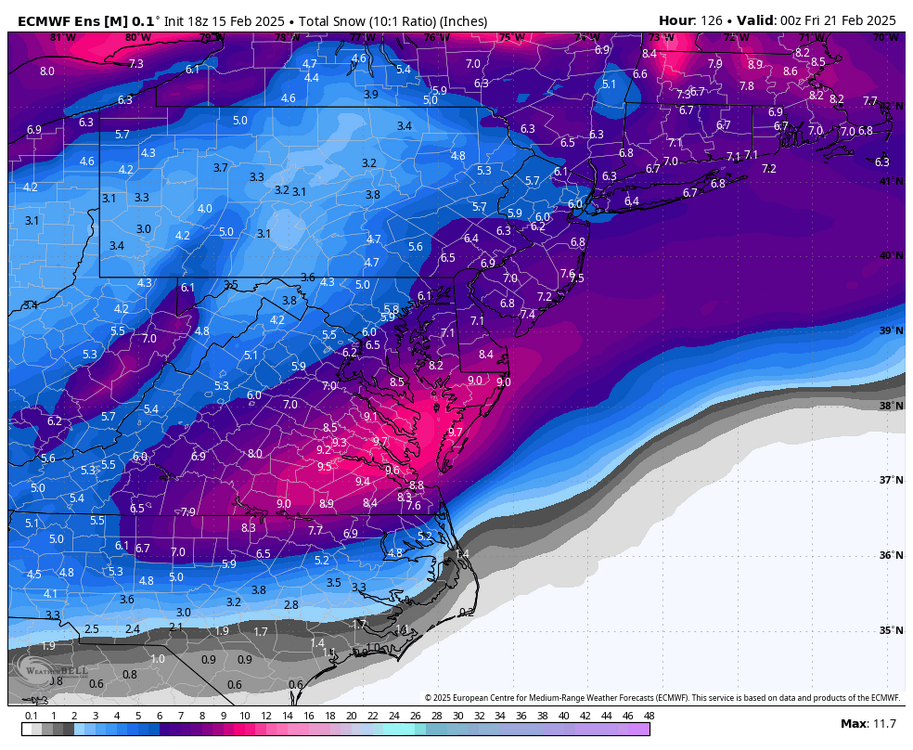
-
Richmond Metro/Hampton Roads Area Discussion
RIC Airport replied to RIC Airport's topic in Mid Atlantic
https://x.com/MikeTFox5/status/1890827123415261670 He makes a good point on why the storm may be farther east. Hopefully it doesn't go too far east, the 18z Euro is just too perfect for our region.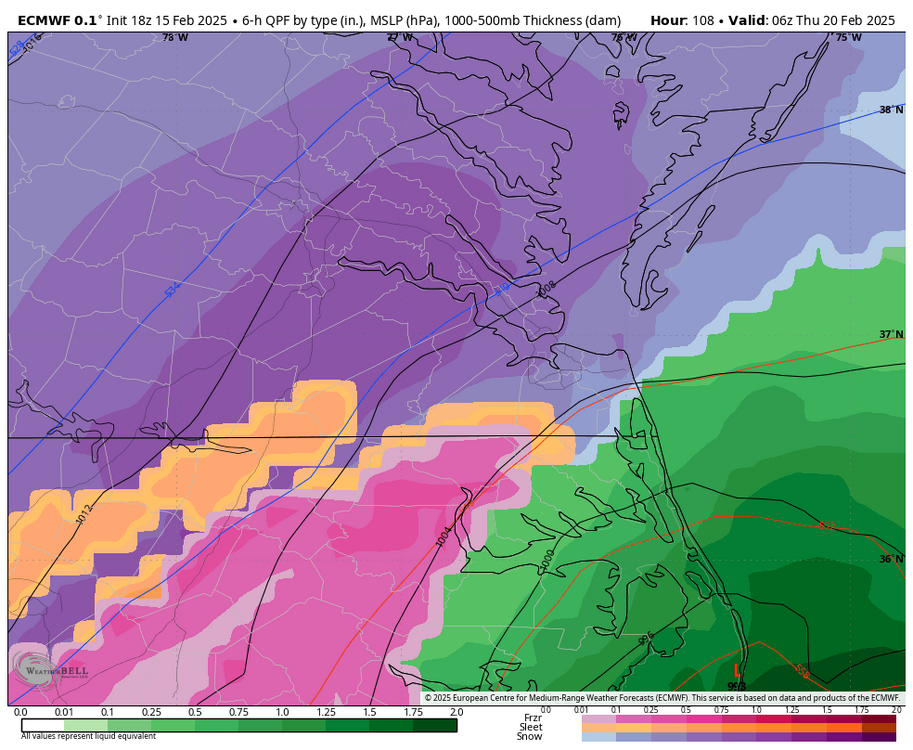

-
Richmond Metro/Hampton Roads Area Discussion
RIC Airport replied to RIC Airport's topic in Mid Atlantic
18z vs the 12z below, seems to be sliding east.

-
Richmond Metro/Hampton Roads Area Discussion
RIC Airport replied to RIC Airport's topic in Mid Atlantic
Not sure I want to post after seeing the Euro. -
Richmond Metro/Hampton Roads Area Discussion
RIC Airport replied to RIC Airport's topic in Mid Atlantic
18z Euro is another big hit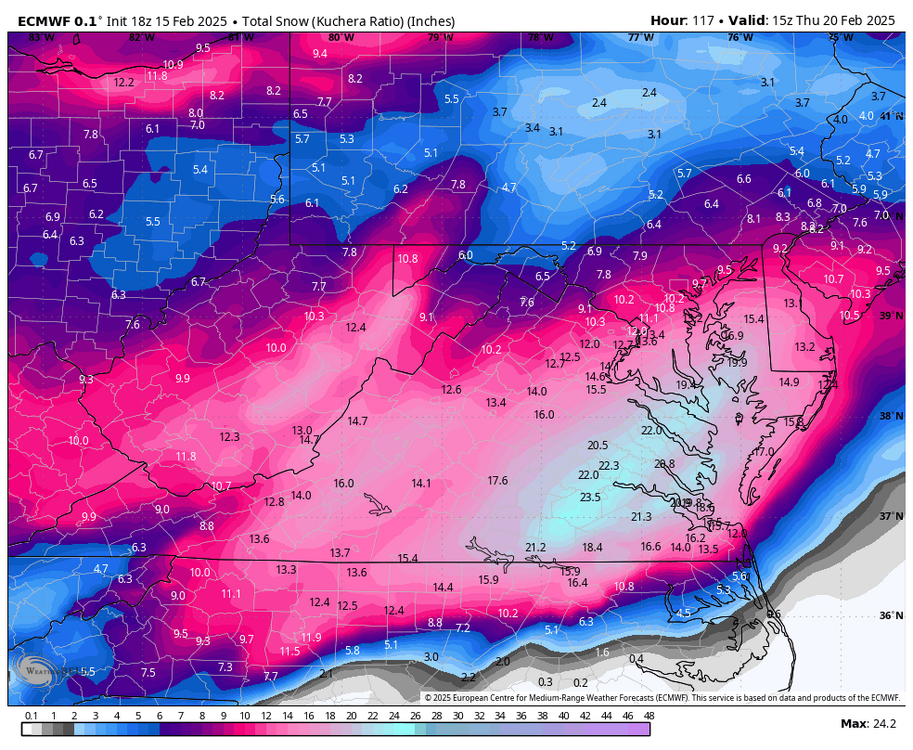
-
Richmond Metro/Hampton Roads Area Discussion
RIC Airport replied to RIC Airport's topic in Mid Atlantic
@wasnow215, when did you move to the area? -
Richmond Metro/Hampton Roads Area Discussion
RIC Airport replied to RIC Airport's topic in Mid Atlantic
The last time there was this much consistency was in January 2016 and December 2009. I think the February 2010 storm as well, although that one shifted north and crushed DC, but Richmond still recorded 7" from it officially. -
Richmond Metro/Hampton Roads Area Discussion
RIC Airport replied to RIC Airport's topic in Mid Atlantic
Yeah, most of that in SE VA on the Euro is on the backside. But if you get an early enough phase and draw down good cold, I can easily see a 4-8" scenario along the coastline, specifically southside Hampton Roads. I think 1-2" on the front end and 3-5" on the back end similar to how the Blizzard of 1996 panned out at ORF. But of course this is all speculation as every storm produces different results. -
Richmond Metro/Hampton Roads Area Discussion
RIC Airport replied to RIC Airport's topic in Mid Atlantic
Definitely signs of a deformation band setting up somewhere, I'm sure the placement of it will fluctuate from run to run.

-
Richmond Metro/Hampton Roads Area Discussion
RIC Airport replied to RIC Airport's topic in Mid Atlantic
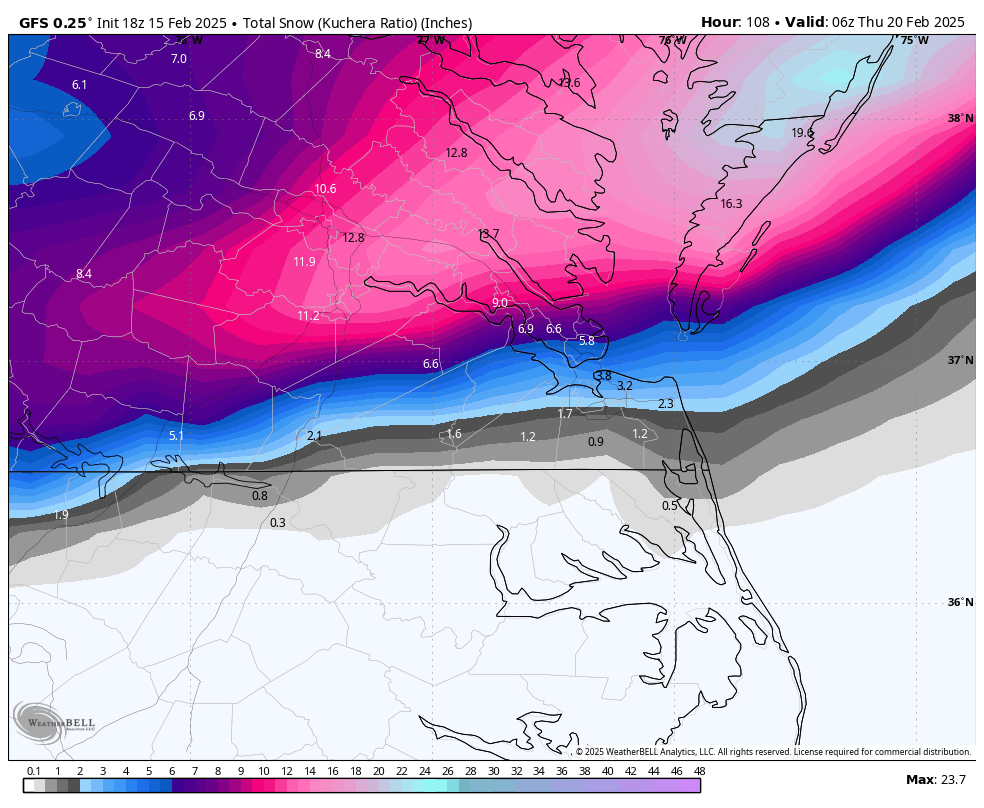
18z GFS is a good hit.