blizzard1024
-
Posts
1,073 -
Joined
Content Type
Profiles
Blogs
Forums
American Weather
Media Demo
Store
Gallery
Everything posted by blizzard1024
-
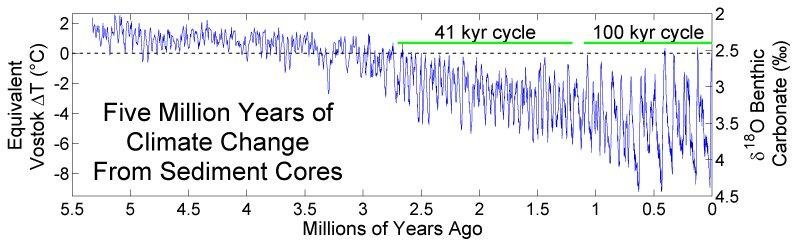
No it's not. There is a lot of uncertainty as to how much CO2 was in the atmosphere plus even bigger was the positioning of the continents was different than today or the last few million years. There was no Gulf Stream or warm current to the North Atlantic. This is really important to the climate system since warmth and moisture that far north leads to snowfall at high latitudes. With the continents closer together the Pacific Ocean was even more massive than today and the continents were closer. Glaciations were not present which made the Earth warmer than today. Once the continents drifted enough to close off the Isthmus of Panama 2.6 million years ago the Gulf stream formed and the "present" glacial to interglacial cycles began and the Earth began to cool. This tells us that its the glaciation and especially ice albedo effect that dominate the climate system. Look at the temperature reconstructions from ocean core forams and you can see this downward trend after 2.6 million years ago. Furthermore, large continental glaciers also means less water vapor in the atmosphere and it is much drier. More and more precipitation falls out as snow and builds the glacier. So water vapor levels drop and hence the world cools more. CO2 passively follows the Earth's temperature. It never drove the climate before. Why does it now?
-
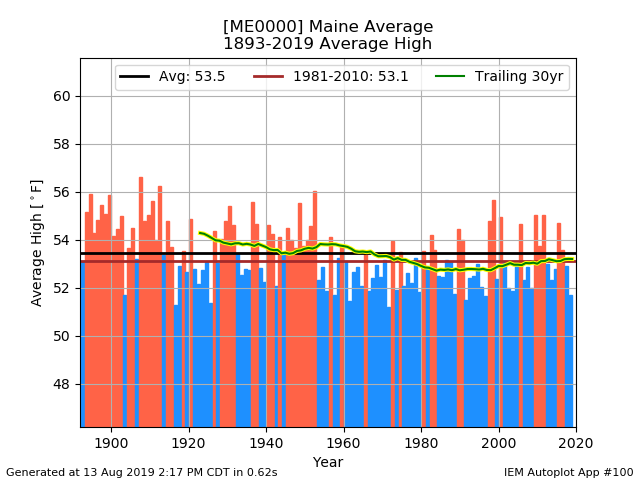
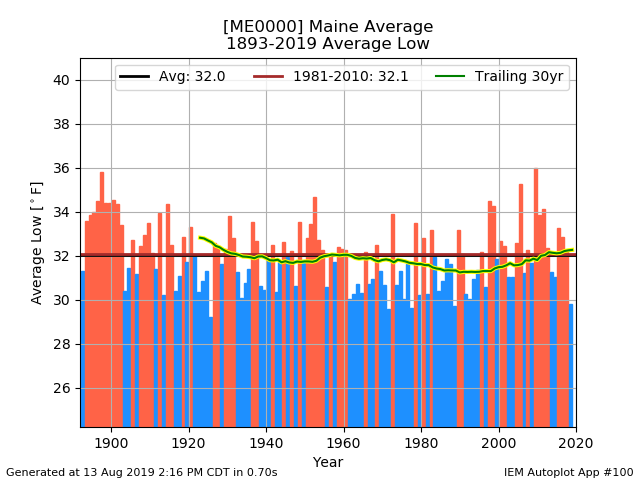
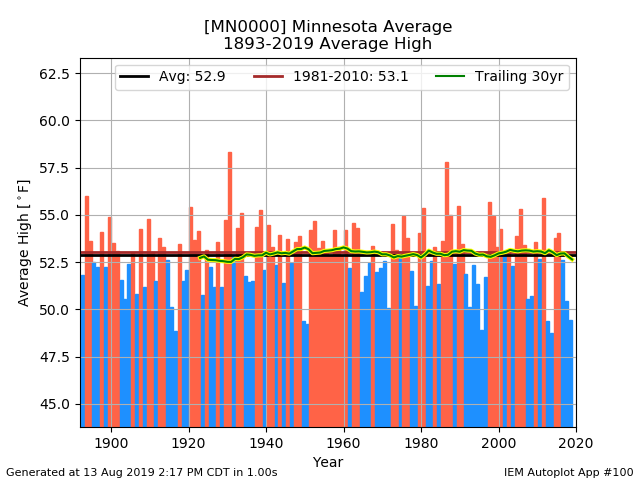
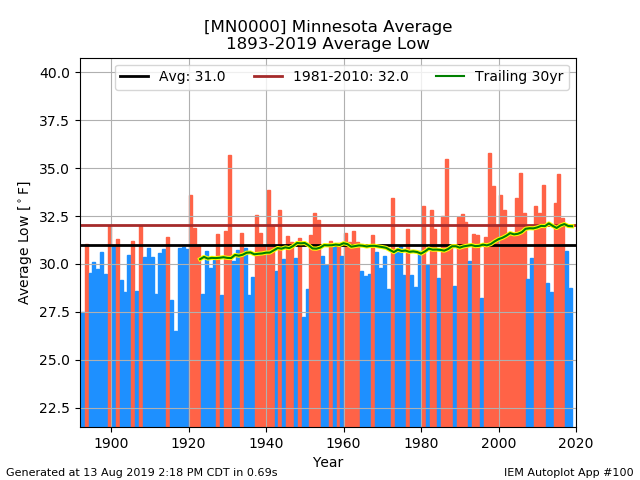
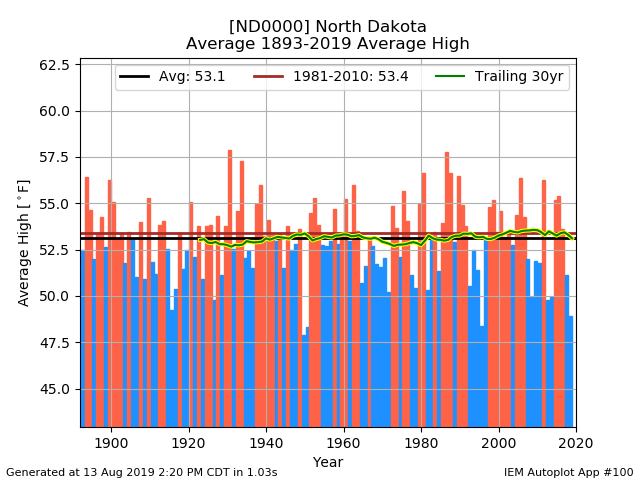
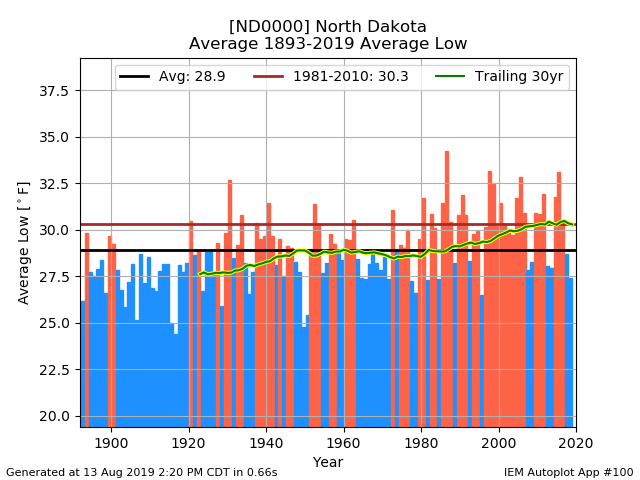
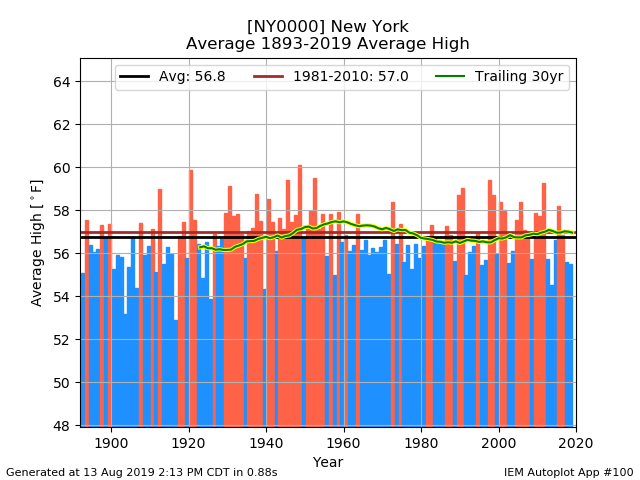
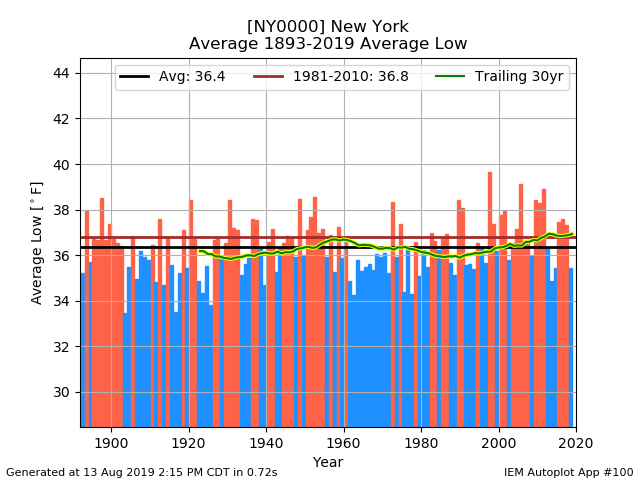
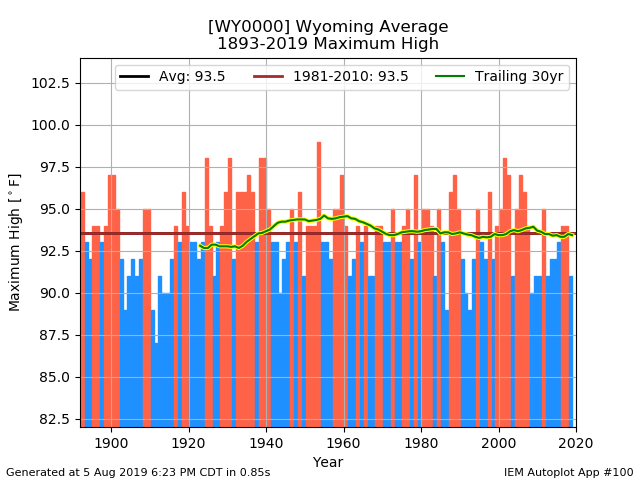
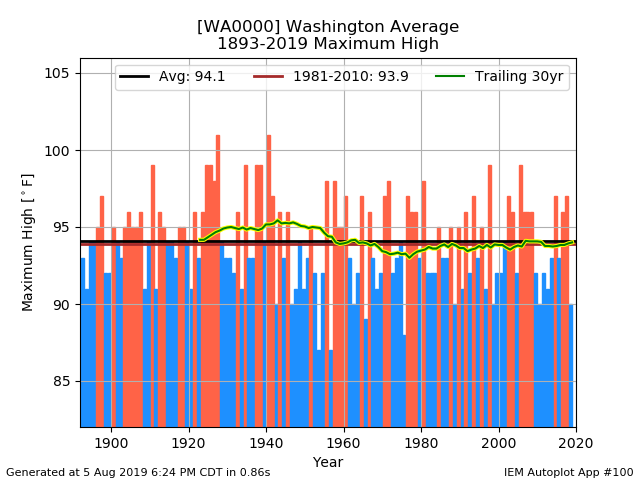
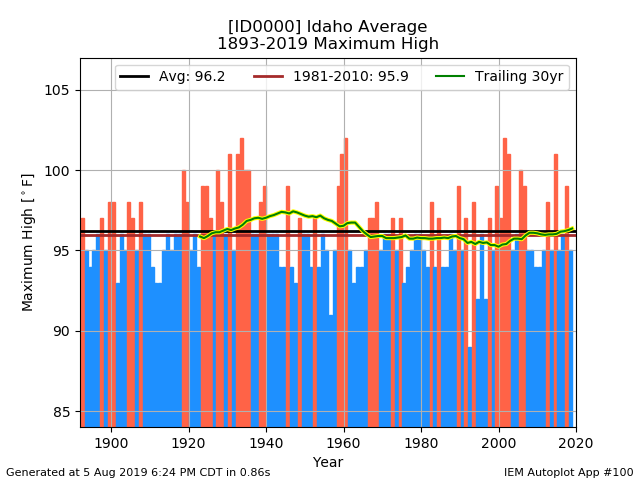
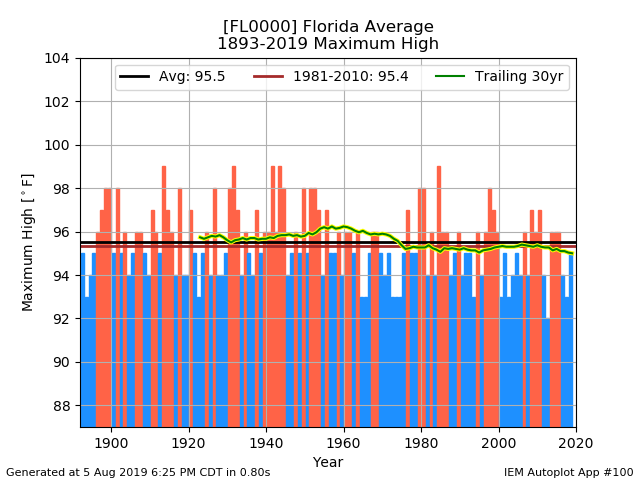
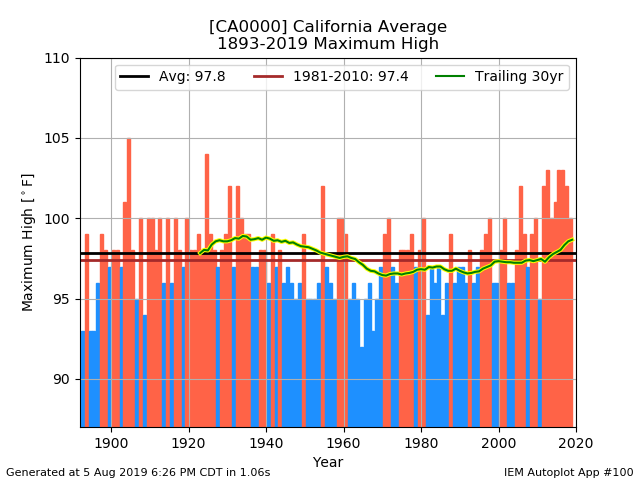
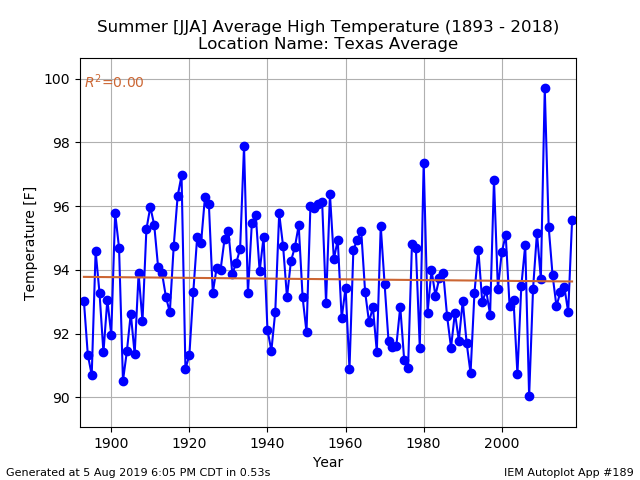
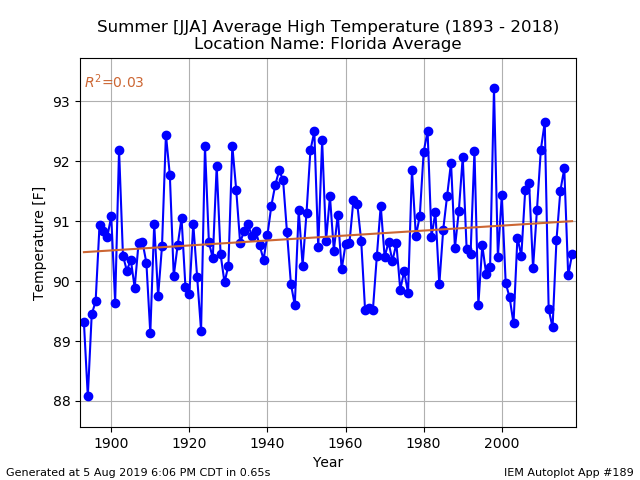
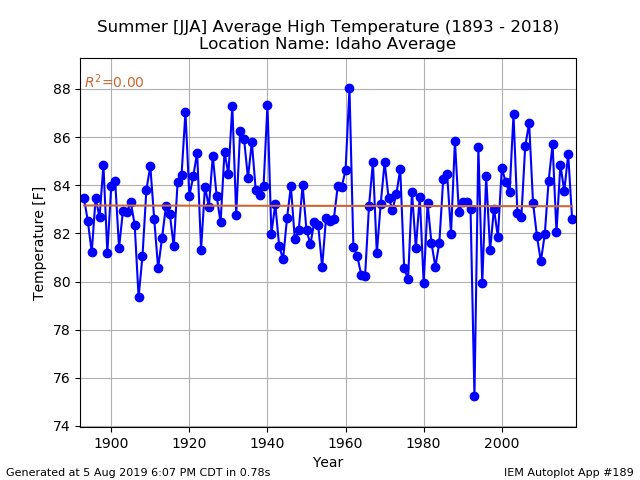
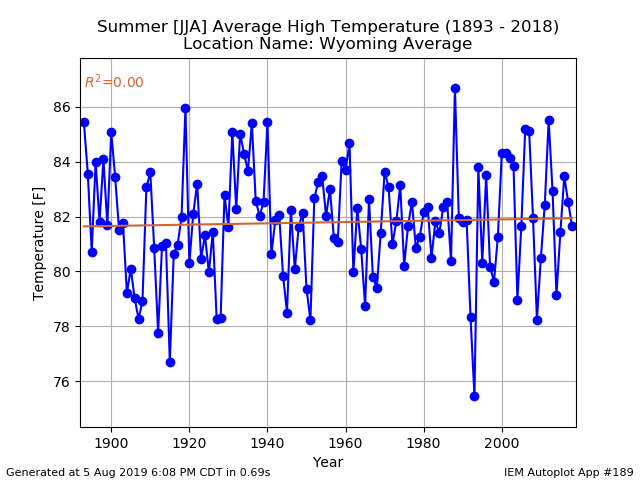
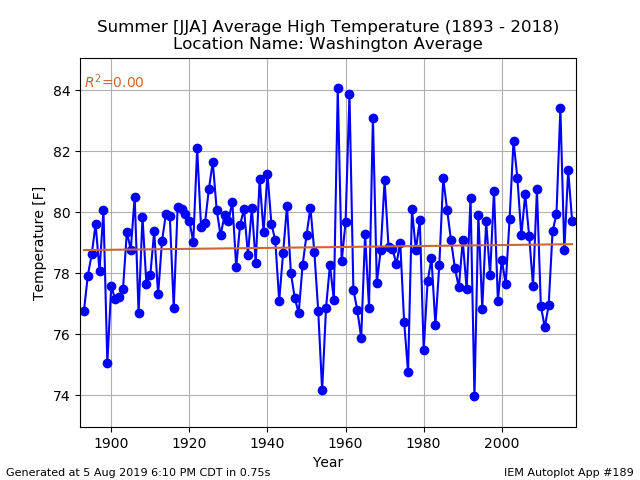
"Since 1960 the surface has warmed by 0.9C with very little if any of that being convincingly attributable to naturally modulated forcing agents. The hydrosphere has taken up heat equivalent to 0.6 W/m^2 of forcing for decades. If a natural (and non-GHG) forcing agent were a significant contributor of this uptake then given this magnitude it should have been quite easy to identify. Meanwhile the observed uptake of heat is a close match to the consensus theory which includes all known radiative forcing agents in their appropriate proportions including GHGs" How do you know this? Climate models? The ice core data clearly reveals that CO2 never dominated our climate system in the past 2.6 million years. So what is different now? It is a weak GHG with a small absorption band. H20 and clouds are 95% of the Earth's greenhouse effect. The whole theory, which is based on models, that CO2 drives the climate NOW is unfounded. Explain to me how a highly non-linear chaotic system is linear in its dependence on CO2 level vs. temperature as is reflected in the ice core data? The easy solution is that the oceans are more soluble to CO2 and other gases when they are colder by sucking CO2 in and outgas it when the Earth warms. This explains the lag in CO2 levels vs temperatures very well. Solar activity was at a 1000 year max in the late 20 century and was at a minimum during the Little Ice Age. How can anyone rule out solar variability in our modern warm period? There is some connection there. There has to be. The hubris that folks on this board and climate scientists have about their understanding of the climate system is crazy. The earth is NOT warming up rapidly either. Where do you get this from? It is a slow rise well within the bounds of previous climate change in the Holocene. The Pleistocene has far larger climate swings. We live in a tranquil time of climate with slow modest warming. Many areas including where I live have not seen any changes in the last 100+ years. Take a look at average annual temperature for several U.S states(best observing network) as an example(below). If we are rapidly warming we certainly would have seen something significantly positive by now. States like NY, ME, MI and ND show small warming to NO changes. Any small warming is night time lows in winter where UHI dominates too. There are many more states that I can run that show the same thing. The climate really hasn't changed much in the U.S since the 1890s based on the raw un-adjusted data. Anyway climate sensitivity has to be low since ice core data shows that temperatures begin to fall as CO2 still climbs. If there were significant positive feedbacks ANY warming that takes places increases CO2 from the Oceans which then would kick in the so-called positive water vapor feedback which would amplify the warming leading to more CO2 from the oceans and more water vapor and so on. What is the breaking mechanism? What is being proposed is the CO2 modulates the hydrological cycle and sets a level for water vapor. Where are the equations for this? I have never seen this. Climate models are woefully inadequate. They don't handle clouds or convection which have a major role in the Earth's energy budget. If you put your faith in this, your nuts. To destroy the energy sector which sets the high standard of living we enjoy is suicide as a species. That is where we are headed. Environmentalism is not helping the planet, it is destroying it by keeping third world countries poor by not allowing access to cheap energy from fossil fuels. Poor people live miserable short lives in third world countries and are desperate so they destroy their environment by hunting and unsustainable farming methods. Environmentalists has brought tons of wind farms which have wrecked loads of wild areas in the northeast U.S and other places. They kill birds and bats. Its horrible. People suffer and the environment is wrecked.
-
This peer reviewed paper has a climate sensitivity of 0.7C per doubling of CO2.... https://www.hindawi.com/journals/ijas/2017/9251034/
-
IPCC Report: Climate Change and Land
blizzard1024 replied to donsutherland1's topic in Climate Change
This is a political document to try to pressure the Trump administration to do something about climate change. The solutions to go renewable are very damaging not only to the world economic system but also the environment. Wind farms ruin wild forests and fields, kill birds and bats. Solar farms use up precious land that was once wild. The insanity is destroying our environment. Given that the Earth was warmer 6000-8000 years ago and our wildlife survived, I don't think a little warming over century long time scales would do any harm if it happens, nature will adapt to slow changes. It always has and always will.... I have to turn off the email notifications from this site. This stuff is just insanity. I'm done with this. -
SMH. Really? you believe this? Of course it is "worse than we thought". If the Earth's climate were this sensitive we wouldn't be here. Life would not exist as rapid changes in the past would have ended up as either a hothouse Earth or an ice house. This is simply propaganda.
-
Attribution Report for the July 2019 Heat in Europe
blizzard1024 replied to donsutherland1's topic in Climate Change
How do you know that? Climate models? Really? Come on. That's lame. Its related to the AMO cycles. It was as warm as in the 1930s and 1940s in the Arctic. Looking at the raw untouched rural data. -
Attribution Report for the July 2019 Heat in Europe
blizzard1024 replied to donsutherland1's topic in Climate Change
Ok. First of all I am not saying the scientists themselves are necessarily not into science per se, but there is no objectivity left in climate science. 30+ years of work tunnel visioned on CO2 leads to warming means massive group-think, which gets into the peer review process. They have been re-enforcing "the CO2 thermostat" hypothesis for 30+ years. If you disagree you are banned. Censored as a scientist. Excellent award winning brilliant scientists like Richard Lindzen, John Christy, Roy Spencer, Willie Soon and more recently Judith Curry have been ostracized. That is why climate science isn't real science anymore IMO. The people that are in it are smart but there is too much inertia to go against the basic "CO2 is the world's thermostat" theory. In summary this is based on computer models only which an objective scientist would question especially given the non-linearities in the atmosphere and climate system. -
Attribution Report for the July 2019 Heat in Europe
blizzard1024 replied to donsutherland1's topic in Climate Change
Look at the data bluewave. The upper troposphere is drying. Since it doesn't fit the narrative they dismiss it. Look at the cloud data from NASA 1983-2009, when there were more clouds on the planet temps cools and vice versa. That dataset is dismissed too. Heck look at the U.S temperature record, NCDC has fudged so much data that many states which show no warming trend in the past hundred plus years after adjustments are now showing 2-3F or more rises per century. And the time of ob has nothing to do with this. High temperature data shows the same trends as low temperature data...none until they adjust the data. I could go on, but the real science deniers are the folks who buy into CAGW and won't even look at the real data or understand rad tran or even understand the earth's atmosphere..... -
Attribution Report for the July 2019 Heat in Europe
blizzard1024 replied to donsutherland1's topic in Climate Change
Science? climate science is not real science..... -
Attribution Report for the July 2019 Heat in Europe
blizzard1024 replied to donsutherland1's topic in Climate Change
How can you say this so confidently? You don't understand the non-linearlities inherent in the Earth's atmosphere. Come on. All your argument is based in climate models. Mine are based on observations. It was warmer before and it could easily warm more. -
Attribution Report for the July 2019 Heat in Europe
blizzard1024 replied to donsutherland1's topic in Climate Change
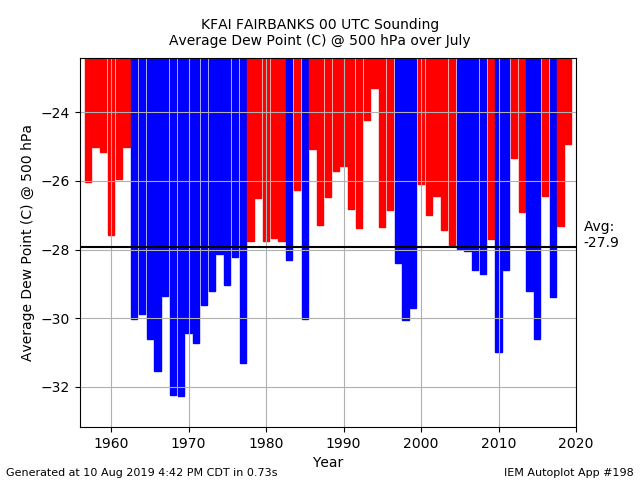
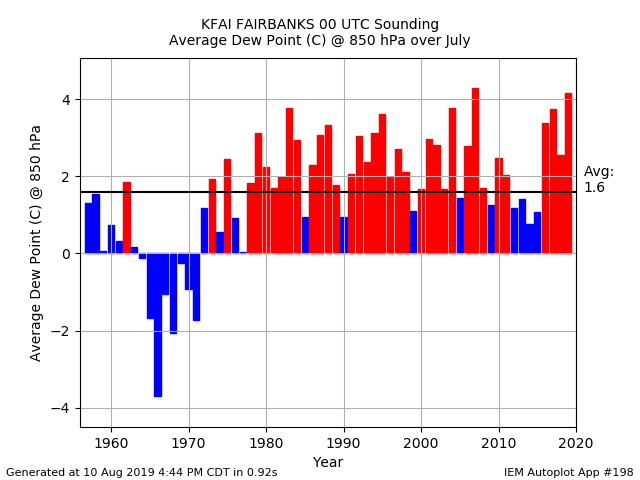
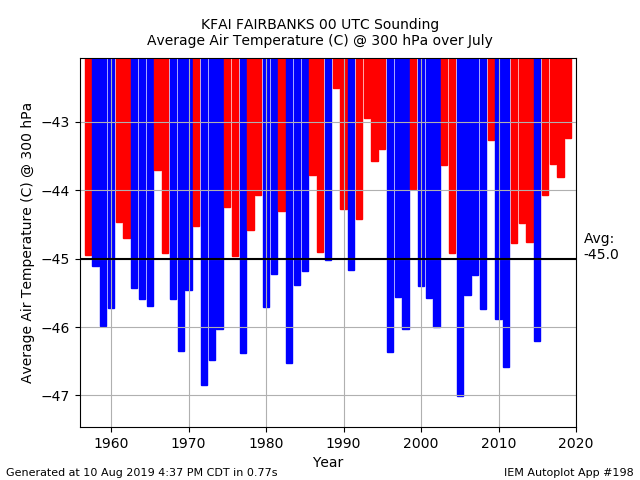
Of note too, look at how it is drying in the upper troposphere....which is a reduction in the main GHG. This is the dewpoint at 300 mb. Significant downward trends. 500 mb is fairly steady and so is 850 mb. This suggests a drying atmosphere (especially upper level where it counts )which compensates for the small increase in CO2. Recent warmth likely due to natural variability. But some scientist I am sure will write a paper in the next week and get it through peer review in another couple weeks and we will be reading about it in this forum. So stay tuned....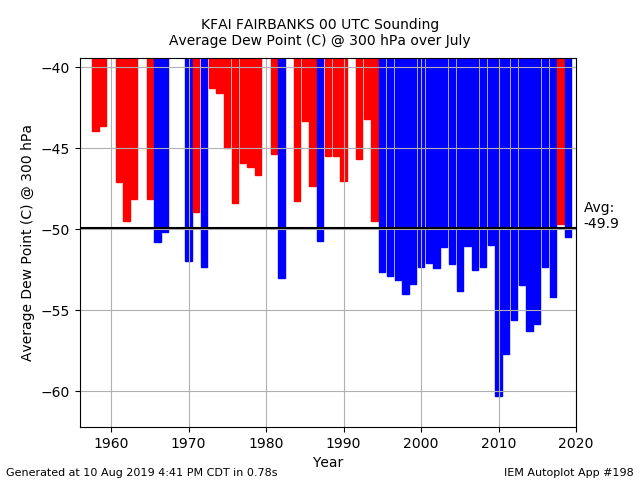
-
Attribution Report for the July 2019 Heat in Europe
blizzard1024 replied to donsutherland1's topic in Climate Change
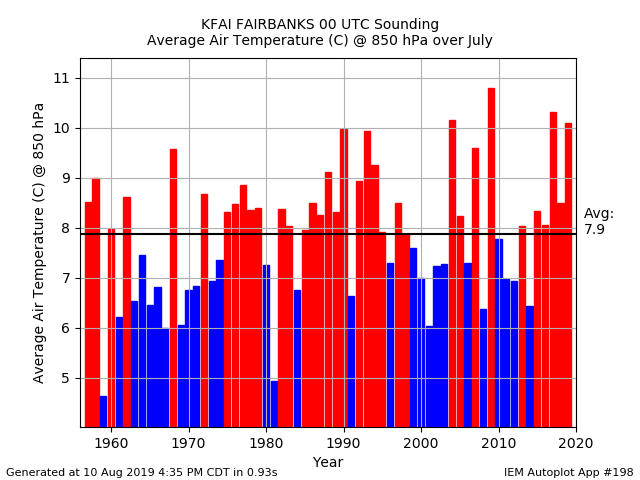
The radiosonde data for Fairbanks clearly shows an above normal month but not a record. Notice how 300 mb data shows very little warming over the long term. This is where CO2 is supposed to warm the atmosphere the most. see below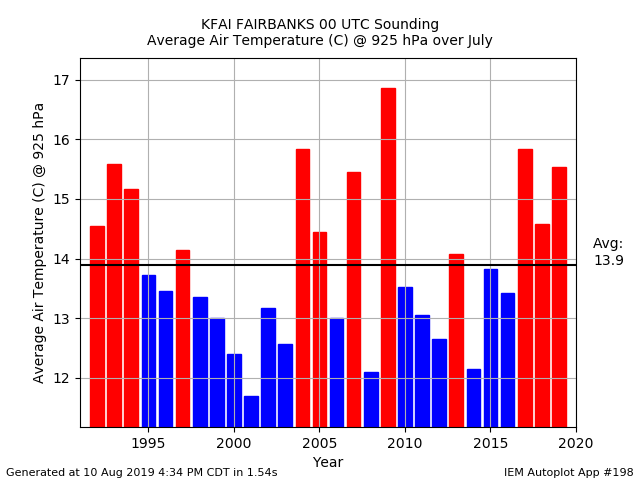
-
Attribution Report for the July 2019 Heat in Europe
blizzard1024 replied to donsutherland1's topic in Climate Change
Forest fires are a natural part of the boreal forest zone. During the Holocene Climatic Optimum temperatures up there were estimated based on pollen cores and the tree line data to be 2-4C warmer than present. Surely, fires have been burning up there for the ages and some years there are more fires and others there are less. This is called variability which weather and climate display on various time scales. Its normal. -
Attribution Report for the July 2019 Heat in Europe
blizzard1024 replied to donsutherland1's topic in Climate Change
Weak GHG somehow dominates the climate system? The thing that is not well described is that temperatures begin to fall despite CO2 rising after an interglacial has ended. If the water vapor feedback is so strong (which it needs to be in order for CO2 to even matter), then how does this happen? Something else triggers the warming, then CO2 responds after 800 year lag and THEN dominates the climate? This does not make any sense. Plus the almost one to one correspondence between CO2 levels and temperatures in the ice cores reveals that the climate system responds to CO2 almost linearly.? But the climate system is highly non-linear. Again makes no sense. What makes sense is the simplicity that colder oceans are more soluble to CO2 and suck it in and then warmer oceans outgass CO2 with a lag of several hundreds years. Hence CO2 is a minor component to the climate system in the grand scheme. This is common sense. There will be no 6th extinction, the world won't end in 12 years and there won't be ecocide because of CO2. We are seeing minor beneficial warming well within the bounds of past climate change in the Holocene. -
Attribution Report for the July 2019 Heat in Europe
blizzard1024 replied to donsutherland1's topic in Climate Change
Ice albedo feedbacks, colder oceans less water vapor and hence colder temperatures. How can CO2 go up and temperatures fall or vice versa if CO2 is the thermostat? It makes no physical sense -
Attribution Report for the July 2019 Heat in Europe
blizzard1024 replied to donsutherland1's topic in Climate Change
Even if it is higher up than RSS there should be more warming based on the enhanced greenhouse theory. We are not seeing this. We don't understand enough about the radiation balances, convection, albedo, ocean current, solar cycles and longer term trends to be blaming most climate change on a trace gas that never mattered in the past. The Vostok ice cores irrefutably prove this. How anyone could look at these ice cores and still believe that CO2 drives climate is beyond me. -
Attribution Report for the July 2019 Heat in Europe
blizzard1024 replied to donsutherland1's topic in Climate Change
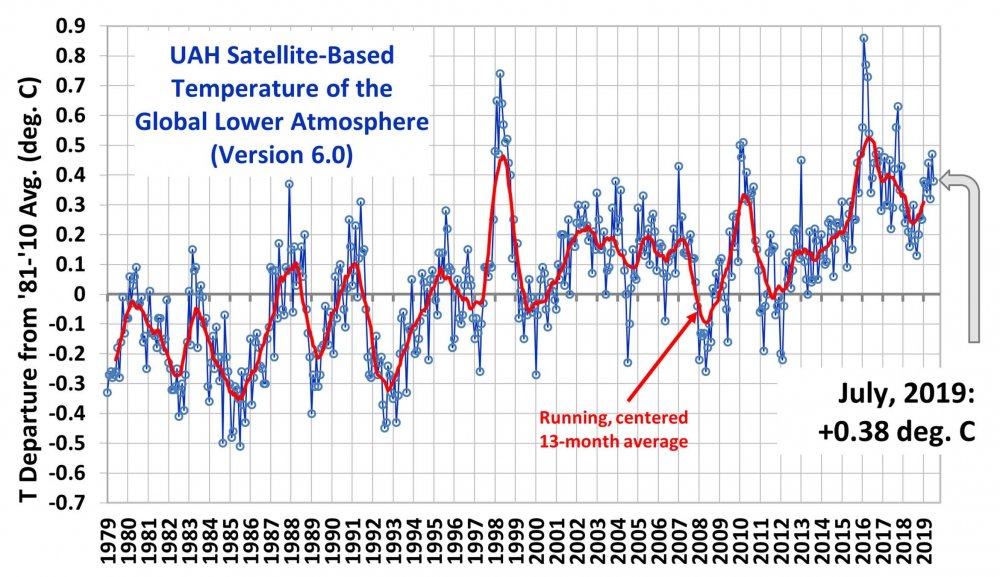
Just read this.... UAH agrees with radiosondes which are a better measure of the atmosphere than the corrupted surface record. Plus MSU 14 is too warm because of drift and the instrument heating itself. see below for a detailed description from Dr Spencer. It clears it up. The RSS wanted to be considered with the others and not the coldest one which is was. Its poltical. see below UAH, RSS, NOAA, UW: Which Satellite Dataset Should We Believe? April 23rd, 2019 NOTE: See the update from John Christy below, addressing the use of RATPAC radiosonde data. This post has two related parts. The first has to do with the recently published study of AIRS satellite-based surface skin temperature trends. The second is our response to a rather nasty Twitter comment maligning our UAH global temperature dataset that was a response to that study. The AIRS Study NASA’s Atmospheric InfraRed Sounder (AIRS) has thousands of infrared channels and has provided a large quantity of new remote sensing information since the launch of the Aqua satellite in early 2002. AIRS has even demonstrated how increasing CO2 in the last 15+ years has reduced the infrared cooling to outer space at the wavelengths impacted by CO2 emission and absorption, the first observational evidence I am aware of that increasing CO2 can alter — however minimally — the global energy budget. The challenge for AIRS as a global warming monitoring instrument is that it is cloud-limited, a problem that worsens as one gets closer to the surface of the Earth. It can only measure surface skin temperatures when there are essentially no clouds present. The skin temperature is still “retrieved” in partly- (and even mostly-) cloudy conditions from other channels higher up in the atmosphere, and with “cloud clearing” algorithms, but these exotic numerical exercises can never get around the fact that the surface skin temperature can only be observed with satellite infrared measurements when no clouds are present. Then there is the additional problem of comparing surface skin temperatures to traditional 2 meter air temperatures, especially over land. There will be large biases at the 1:30 a.m./p.m. observation times of AIRS. But I would think that climate trends in skin temperature should be reasonably close to trends in air temperature, so this is not a serious concern with me (although Roger Pielke, Sr. disagrees with me on this). The new paper by Susskind et al. describes a 15-year dataset of global surface skin temperatures from the AIRS instrument on NASA’s Aqua satellite.ScienceDaily proclaimed that the study “verified global warming trends“, even though the period addressed (15 years) is too short to say much of anything much of value about global warming trends, especially since there was a record-setting warm El Nino near the end of that period. Furthermore, that period (January 2003 through December 2017) shows significant warming even in our UAH lower tropospheric temperature (LT) data, with a trend 0.01 warmer than the “gold standard” HadCRUT4 surface temperature dataset (all deg. C/decade): AIRS: +0.24 GISTEMP: +0.22 ECMWF: +0.20 Cowtan & Way: +0.19 UAH LT: +0.18 HadCRUT4: +0.17 I’m pretty sure the Susskind et al. paper was meant to prop up Gavin Schmidt’s GISTEMP dataset, which generally shows greater warming trends than the HadCRUT4 dataset that the IPCC tends to favor more. It remains to be seen whether the AIRS skin temperature dataset, with its “clear sky bias”, will be accepted as a way to monitor global temperature trends into the future. What Satellite Dataset Should We Believe? Of course, the short period of record of the AIRS dataset means that it really can’t address the pre-2003 adjustments made to the various global temperature datasets which significantly impact temperature trends computed with 40+ years of data. What I want to specifically address here is a public comment made by Dr. Scott Denning on Twitter, maligning our (UAH) satellite dataset. He was responding to someone who objected to the new study, claiming our UAH satellite data shows minimal warming. While the person posting this objection didn’t have his numbers right (and as seen above, our trend even agrees with HadCRUT4 over the 2003-2017 period), Denning took it upon himself to take a swipe at us (see his large-font response, below): First of all, I have no idea what Scott is talking about when he lists “towers” and “aircraft”…there has been no comprehensive comparisons of such data sources to global satellite data, mainly because there isn’t nearly enough geographic coverage by towers and aircraft. Secondly, in the 25+ years that John Christy and I have pioneered the methods that others now use, we made only one “error” (found by RSS, and which we promptly fixed, having to do with an early diurnal drift adjustment). The additional finding by RSS of the orbit decay effect was not an “error” on our part any more than our finding of the “instrument body temperature effect” was an error on their part. All satellite datasets now include adjustments for both of these effects. Nevertheless, as many of you know, our UAH dataset is now considered the “outlier” among the satellite datasets (which also include RSS, NOAA, and U. of Washington), with the least amount of global-average warming since 1979 (although we agree better in the tropics, where little warming has occurred). So let’s address the remaining claim of Scott Denning’s: that we disagree with independent data. The only direct comparisons to satellite-based deep-layer temperatures are from radiosondes and global reanalysis datasets (which include all meteorological observations in a physically consistent fashion). What we will find is that RSS, NOAA, and UW have remaining errors in their datasets which they refuse to make adjustments for. From late 1998 through 2004, there were two satellites operating: NOAA-14 with the last of the old MSU series of instruments on it, and NOAA-15 with the first new AMSU instrument on it. In the latter half of this overlap period there was considerable disagreement that developed between the two satellites. Since the older MSU was known to have a substantial measurement dependence on the physical temperature of the instrument (a problem fixed on the AMSU), and the NOAA-14 satellite carrying that MSU had drifted much farther in local observation time than any of the previous satellites, we chose to cut off the NOAA-14 processing when it started disagreeing substantially with AMSU. (Engineer James Shiue at NASA/Goddard once described the new AMSU as the “Cadillac” of well-calibrated microwave temperature sounders). Despite the most obvious explanation that the NOAA-14 MSU was no longer usable, RSS, NOAA, and UW continue to use all of the NOAA-14 data through its entire lifetime and treat it as just as accurate as NOAA-15 AMSU data. Since NOAA-14 was warming significantly relative to NOAA-15, this puts a stronger warming trend into their satellite datasets, raising the temperature of all subsequent satellites’ measurements after about 2000. But rather than just asserting the new AMSU should be believed over the old (drifting) MSU, let’s look at some data. Since Scott Denning mentions weather balloon (radiosonde) data, let’s look at our published comparisonsbetween the 4 satellite datasets and radiosondes (as well as global reanalysis datasets) and see who agrees with independent data the best: Trend differences 1979-2005 between 4 satellite datasets and either radiosondes (blue) or reanalyses (red) for the MSU2/AMSU5 tropospheric channel in the tropics. The balloon trends are calculated from the subset of gripoints where the radiosonde stations are located, whereas the reanalyses contain complete coverage of the tropics. For direct comparisons of full versus station-only grids see the paper. Clearly, the RSS, NOAA, and UW satellite datasets are the outliers when it comes to comparisons to radiosondes and reanalyses, having too much warming compared to independent data. But you might ask, why do those 3 satellite datasets agree so well with each other? Mainly because UW and NOAA have largely followed the RSS lead… using NOAA-14 data even when its calibration was drifting, and using similar strategies for diurnal drift adjustments. Thus, NOAA and UW are, to a first approximation, slightly altered versions of the RSS dataset. Maybe Scott Denning was just having a bad day. In the past, he has been reasonable, being the only climate “alarmist” willing to speak at a Heartland climate conference. Or maybe he has since been pressured into toeing the alarmist line, and not being allowed to wander off the reservation. In any event, I felt compelled to defend our work in response to what I consider (and the evidence shows) to be an unfair and inaccurate attack in social media of our UAH dataset. UPDATE from John Christy (11:10 CDT April 26, 2019): In response to comments about the RATPAC radiosonde data having more warming, John Christy provides the following: The comparison with RATPAC-A referred to in the comments below is unclear (no area mentioned, no time frame). But be that as it may, if you read our paper, RATPAC-A2 was one of the radiosonde datasets we used. RATPAC-A2 has virtually no adjustments after 1998, so contains warming shifts known to have occurred in the Australian and U.S. VIZ sondes for example. The IGRA dataset used in Christy et al. 2018 utilized 564 stations, whereas RATPAC uses about 85 globally, and far fewer just in the tropics where this comparison shown in the post was made. RATPAC-A warms relative to the other radiosonde/reanalyses datasets since 1998 (which use over 500 sondes), but was included anyway in the comparisons in our paper. The warming bias relative to 7 other radiosonde and reanalysis datasets can be seen in the following plot: -
Attribution Report for the July 2019 Heat in Europe
blizzard1024 replied to donsutherland1's topic in Climate Change
RSS adjusted their dataset to account for diurnal drift using model data instead of real data and hence now is way warmer than it should be. UAH is the only dataset that still matches the upper air balloons. I trust the UAH because it is confirmed by this totally different dataset -
Attribution Report for the July 2019 Heat in Europe
blizzard1024 replied to donsutherland1's topic in Climate Change
This whole thread irks me because it is part of hyping global warming. Every storm, every heat wave, every flood, even cold waves and snowstorms now are supercharged by CO2 induced global warming. A reasonable atmospheric scientist knows this is just simply not true. The headlines from Europe were " We caused this heat wave" and other similar headlines. This is blatant hype to convince people into paying more for energy through switching to renewables before it is cost effective. Yes I do believe that increasing CO2 will warm the Earth some. Physics says it would be around 1.2C per doubling. OK. I do believe the surface record is rife with inaccuracies especially the oceans. I do believe that climate scientists have been adjusting data to show more warming than is present. I don't believe that modest warming that we are seeing is going to destroy the planet. Warming is good. Cooling is bad. We are warming on the order of 1 to 2C per century which is well within the bounds of past climate change in the Holocene. There is no reason to panic. We need to slowly switch to renewables in the next 50 to 100 years as technology evolves only because we will run out of cheap fossil fuels. Doing this before it is cheap enough will crash the worlds economy. -
Attribution Report for the July 2019 Heat in Europe
blizzard1024 replied to donsutherland1's topic in Climate Change
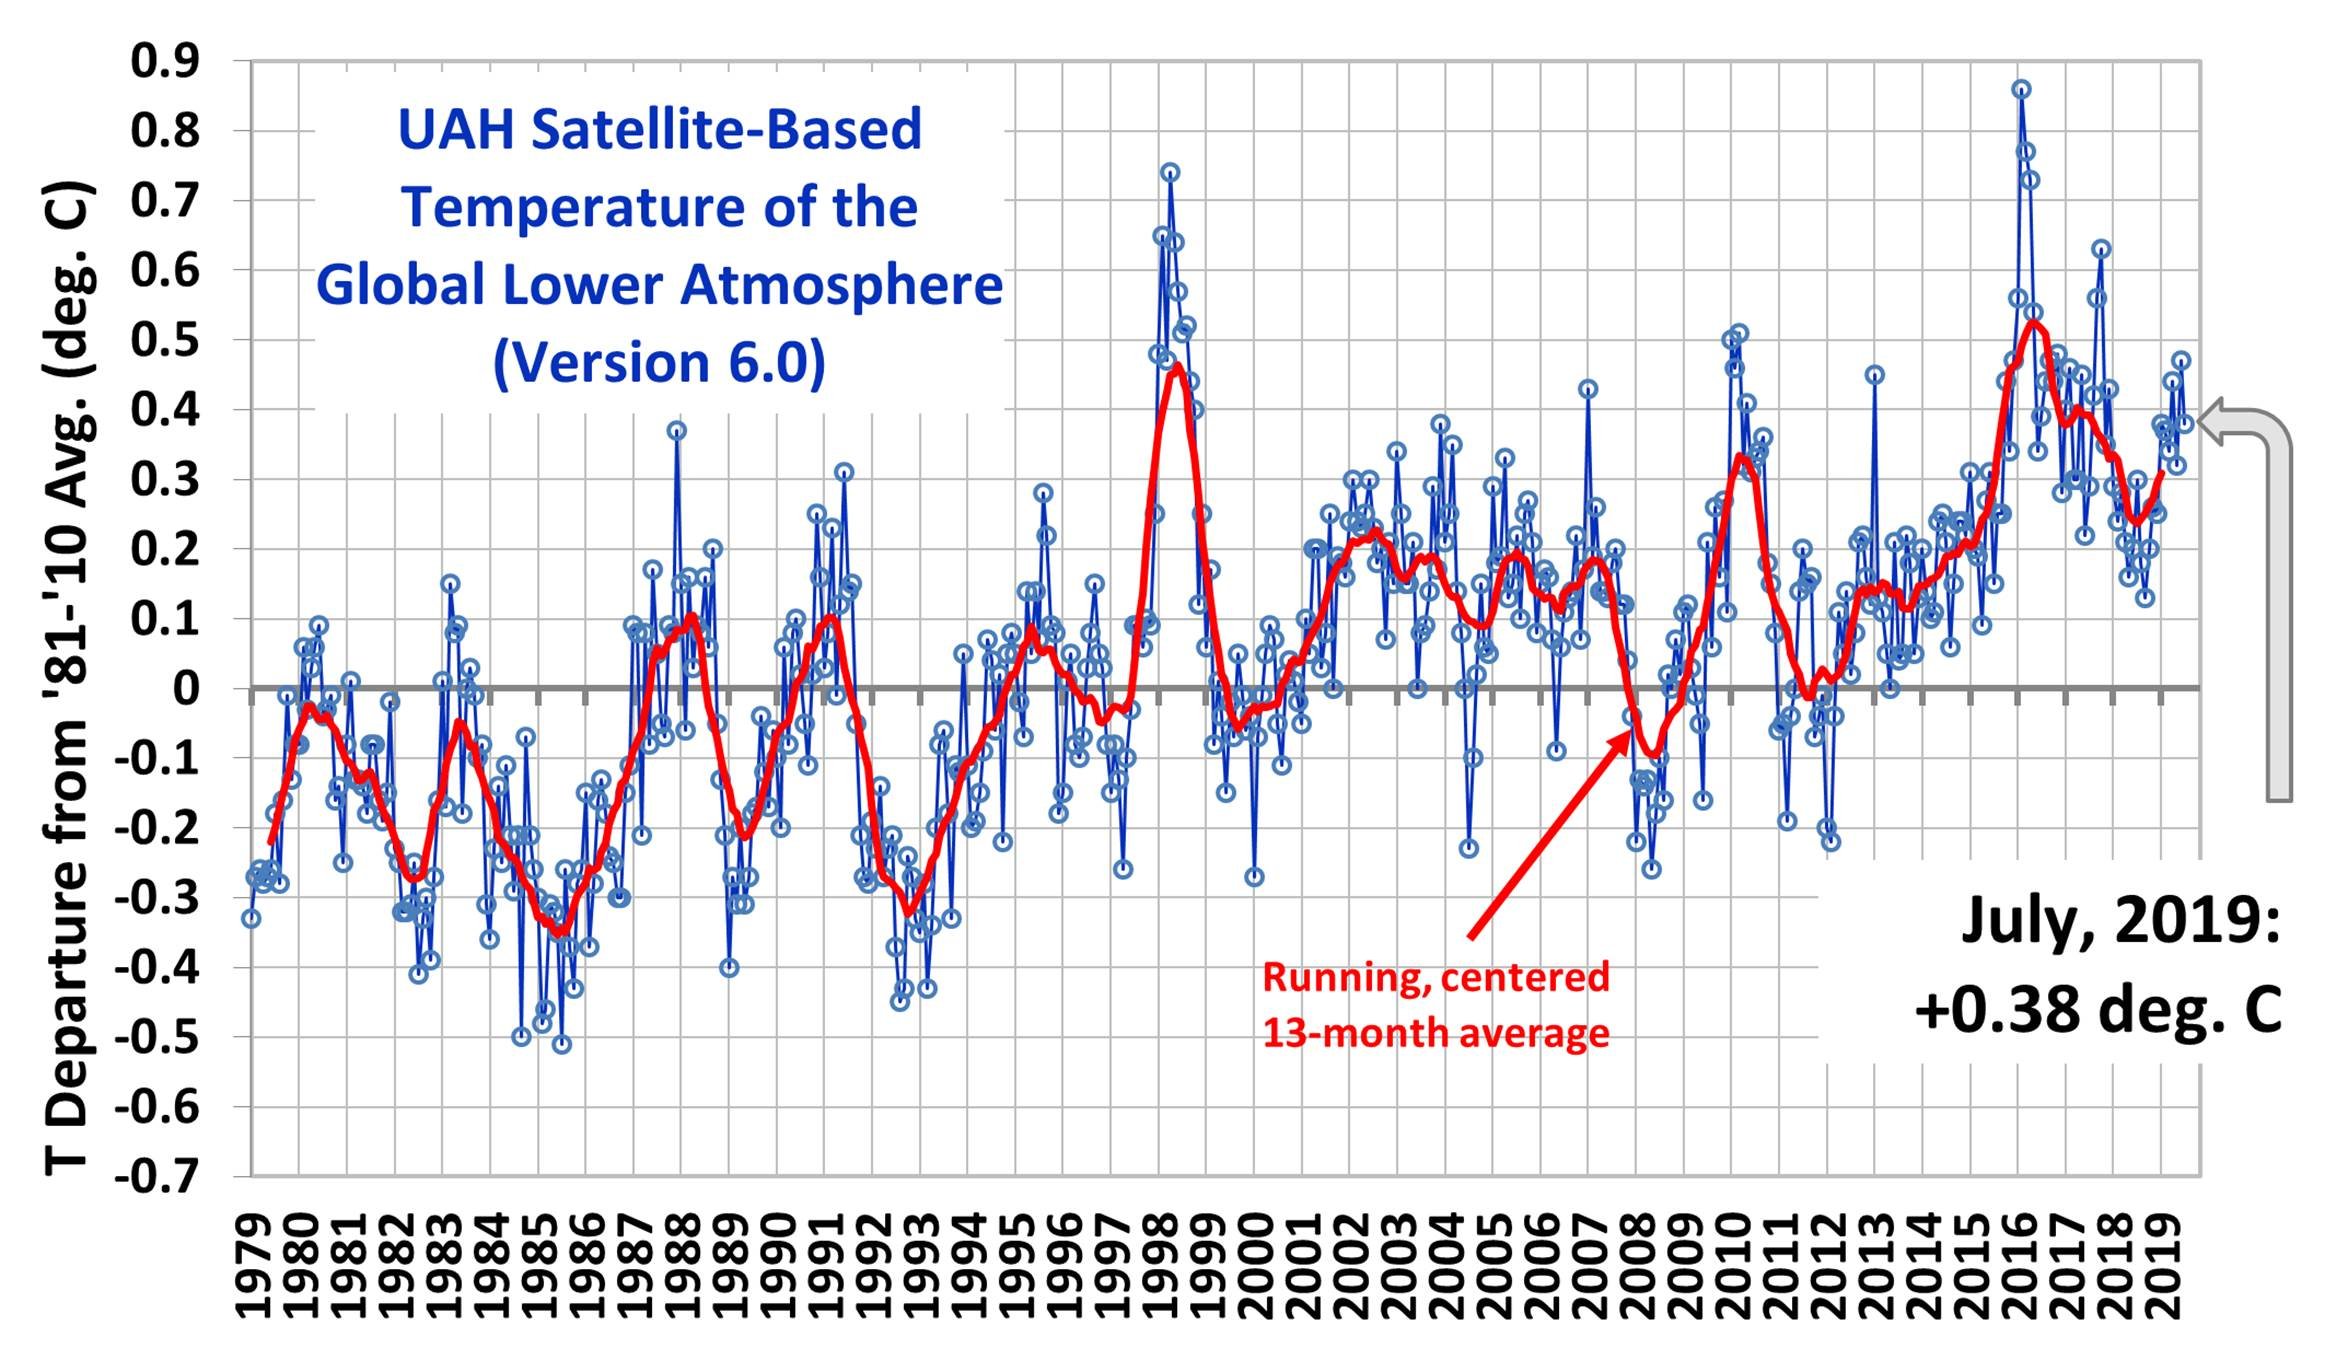
Remember this dataset began during the end of the 1970s cool phase. So of course it has warmed since then. The long term records back to the 1890s for rural stations in the U.S show little warming and a definite warm spike in the 1930s and 1940s. Then a cooling 1940s to 1970s. -
Attribution Report for the July 2019 Heat in Europe
blizzard1024 replied to donsutherland1's topic in Climate Change
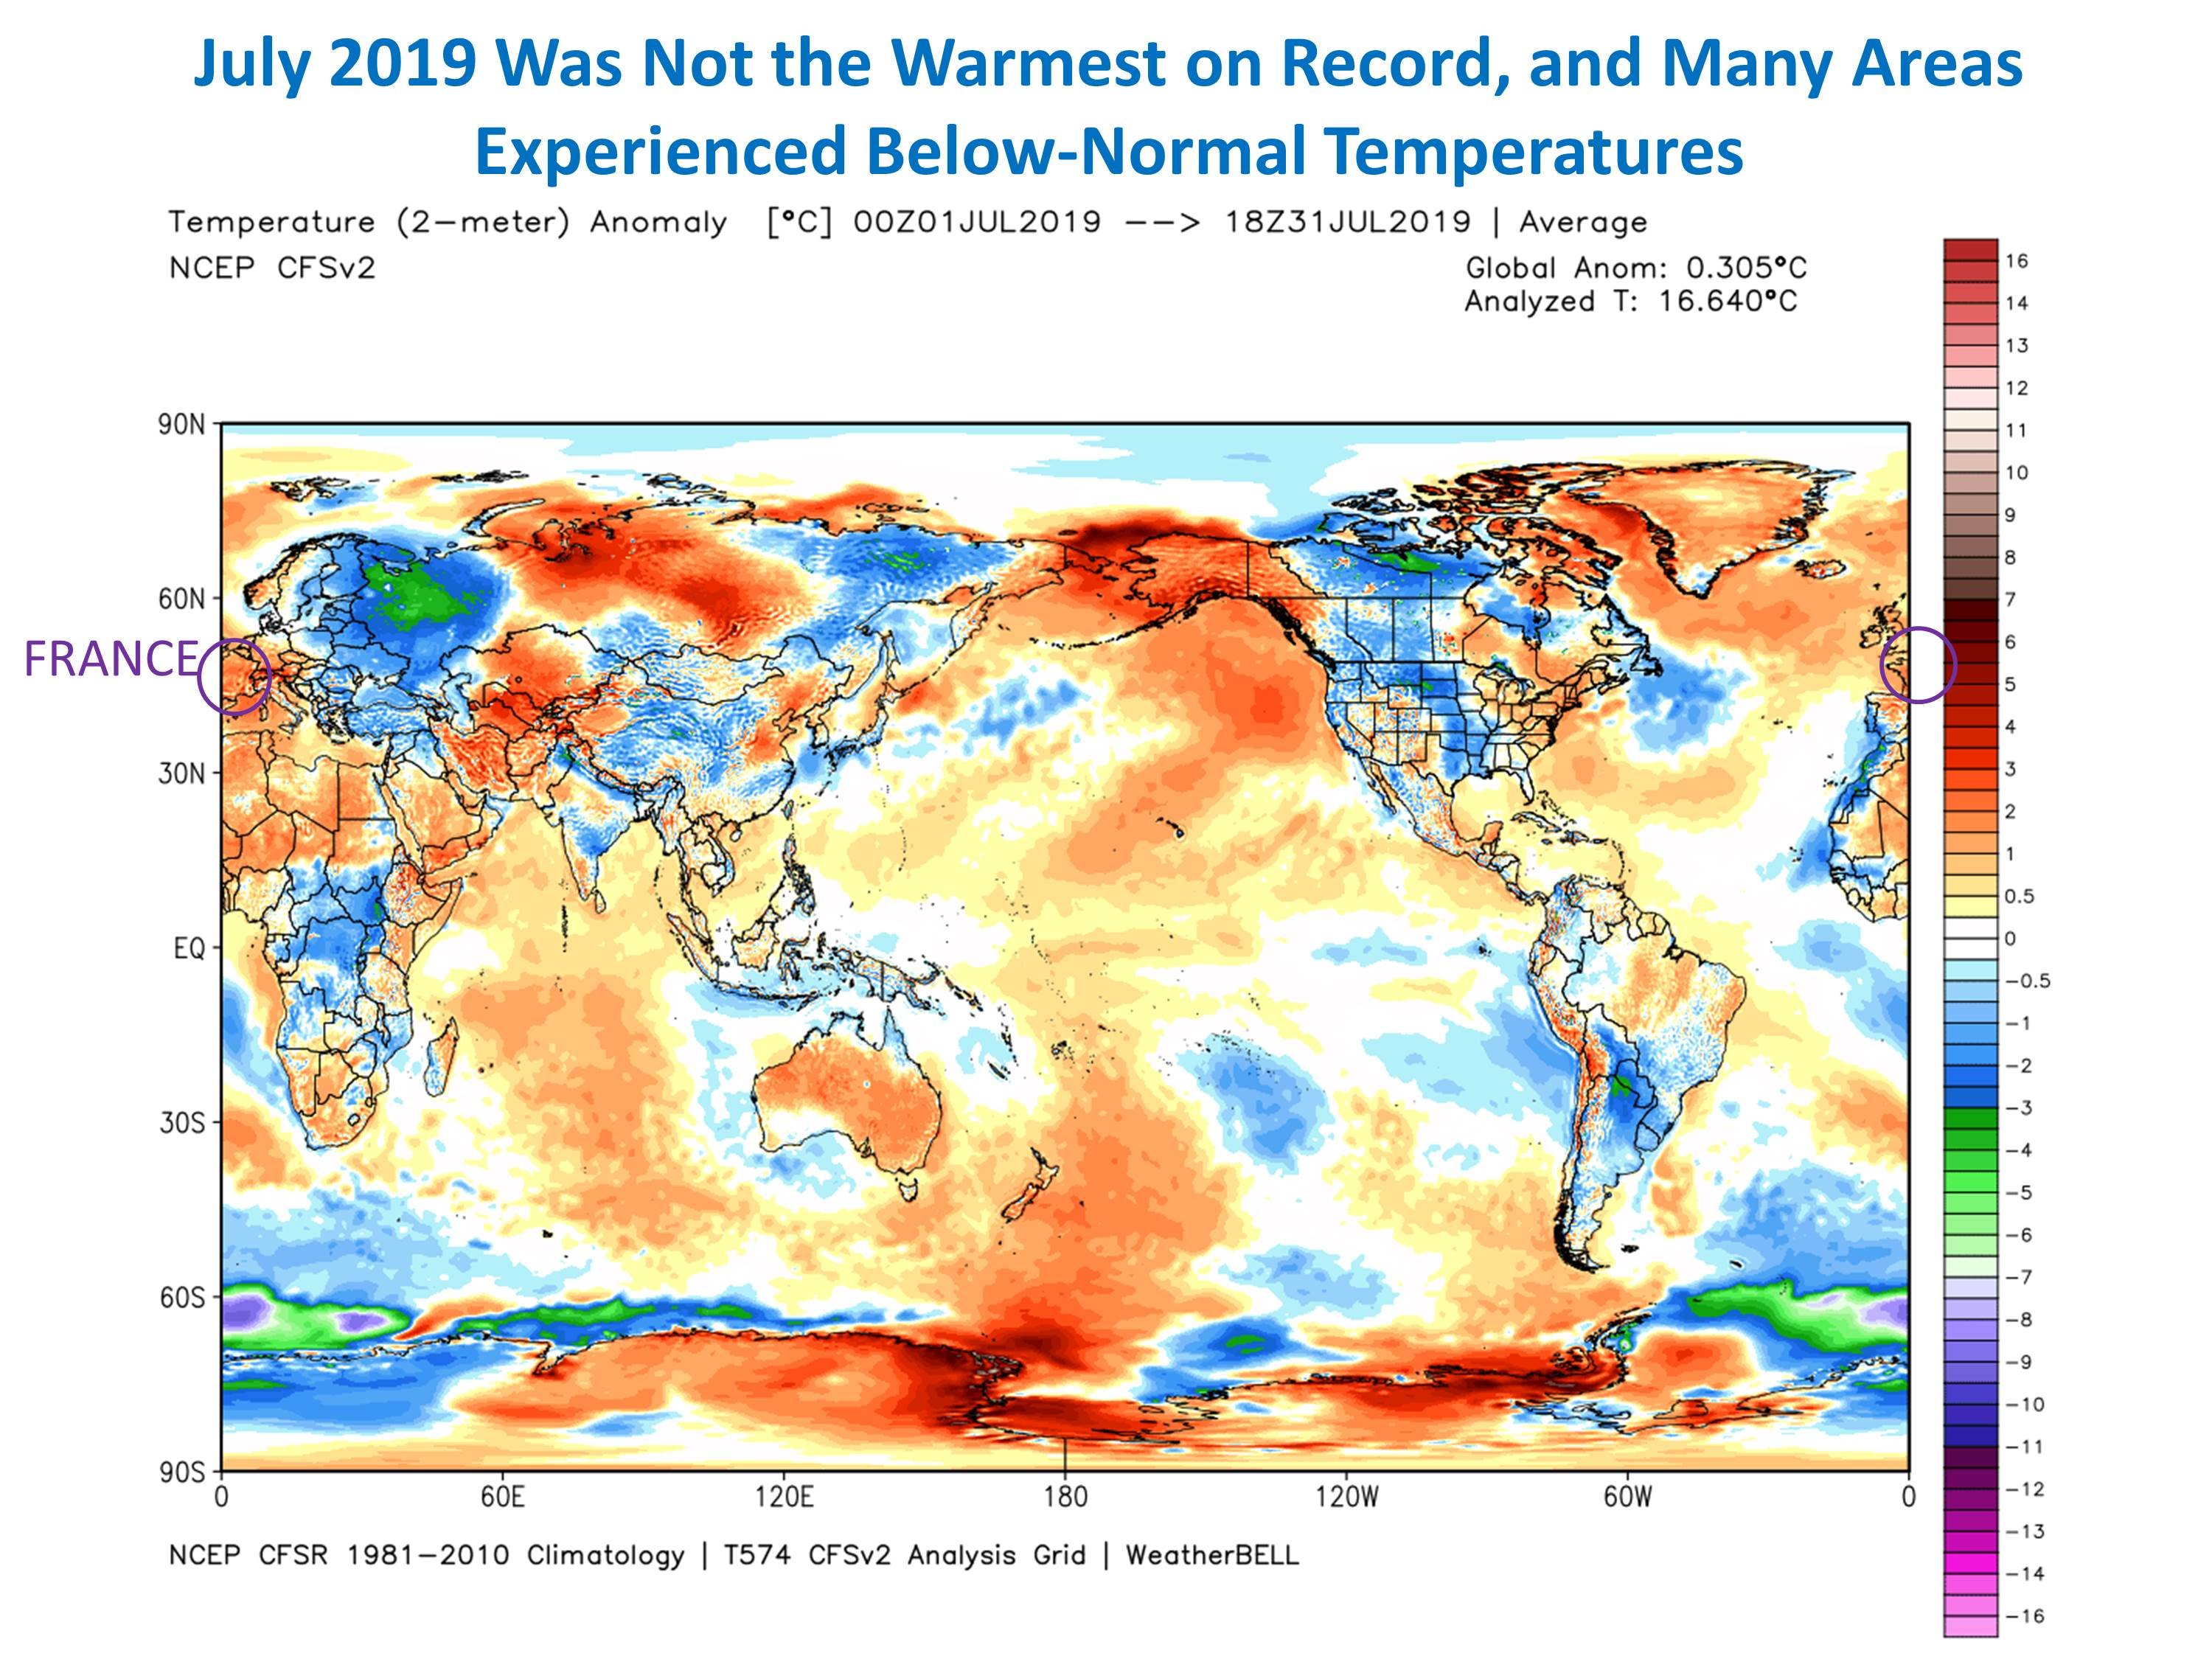
The UAH Satellite record had +.38C for July which is minimal. The CFSV2 reanalysis data shows +.305C for July....hardly anything to go nuts over. The record lows are skewed because of UHI. Plain and simple.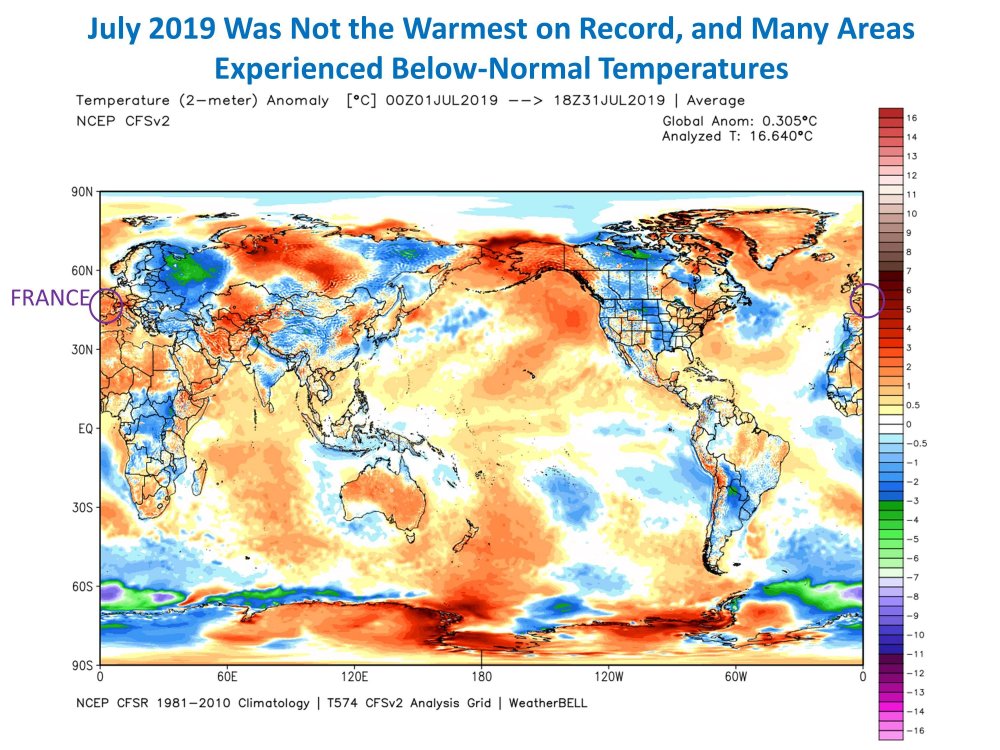
-
Attribution Report for the July 2019 Heat in Europe
blizzard1024 replied to donsutherland1's topic in Climate Change
-
Attribution Report for the July 2019 Heat in Europe
blizzard1024 replied to donsutherland1's topic in Climate Change
-
Attribution Report for the July 2019 Heat in Europe
blizzard1024 replied to donsutherland1's topic in Climate Change
https://wattsupwiththat.com/2019/07/02/record-high-temperatures-in-france-3-facts-the-media-dont-tell-you/ -
Attribution Report for the July 2019 Heat in Europe
blizzard1024 replied to donsutherland1's topic in Climate Change
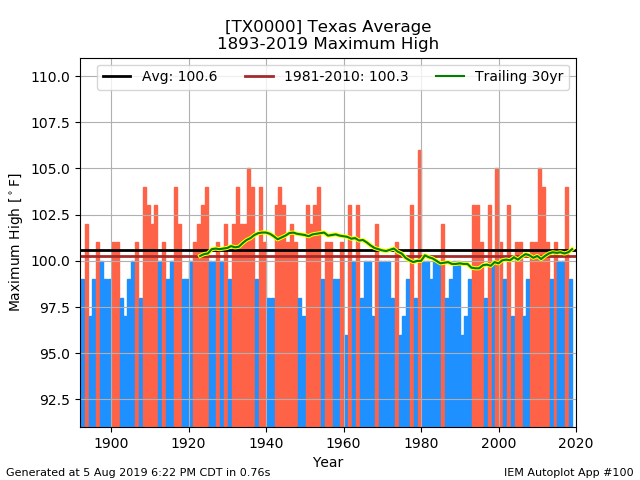
Where is the data to support your assertion that heat wave occurrences are going up globally? Certainly that is not the case in the U.S. The 1930s had the most heat based on the data. If anything extreme maximums have been declining in the U.S. Winter temps have warmed up a bit.