
high risk
-
Posts
3,214 -
Joined
-
Last visited
Content Type
Profiles
Blogs
Forums
American Weather
Media Demo
Store
Gallery
Everything posted by high risk
-
This thread is reminding me why I love summer: the long hours of daylight, the warm breezes, and not have to look at a stupidly-inflated Kuchera plot for 8 months.
-
I think this is a great point - social science is really going to be a factor here. Tomorrow's decision will be made with Tuesday's decision fresh in their minds, and they'll absolutely be scared to death of another delay or closing that ends up not needed. And it seems like a 2h delay wouldn't accomplish much tomorrow, as it will be cold and snowing 2 hours later. It's probably either a "normal day" or "closure" decision.
-
What stands out to me is that even if the totals are very light, temperatures at onset are in the mid to upper 20s for most of us (except maybe for the far southern crew). With the earlier onset, as others have noted, the morning rush hour could be very tricky, and school systems are going to have some very challenging decisions to make.
-
This is bothering me a lot, as the NAMs are usually the colder solutions. I think we're still in the range where the NAM could be having synoptic issues, but if it continues on Monday to keep the accumulations further northwest of the I-95 corridor, I'm going to guess it's right. The faster onset, shown by the GFS and its hi-res HiResW FV3, would help a ton here, although even where it shows snow, the thermal profile has pretty much zero margin for error.
-
NAMs will around through at least the rest of this winter.
-
Incredibly tricky temperature forecasts this weekend. Warm air will be lurking just our south and southwest, but there is increasing concern now that we'll end up on the cooler side of the boundary each day.
-
While we'll be freezing tomorrow, there is very good model agreement that we get quite warm on Sunday.
-
These low reflectivity/high wind event fascinate me.
-
Personally, I look at both the HRRR and NAM Nest as my go-to CAMs. The 3 Hi-Res Windows are lower on my list. The HRRR and NAM Nest both have their strengths and weaknesses. The HRRR has a big advantage in running hourly, and there are things it does to create a more accurate starting point (a sophisticated assimilation of radar data, heavy usage of surface obs....) The NAM Nest hasn't been updated in 8 years. The HRRR hasn't had a recent update but was last updated 4 years ago. In terms of biases with rainfall, NAM Nest tends to run wet, but the HRRR sometimes runs dry - might be microphysics, but tough to confirm. And the HRRR is very sensitive to the hourly updates, so its solutions bounce around a lot. The NAM Nest tends to be too cool with sfc temps, but it handles low-level inversions way better than the HRRR due to a better PBL scheme. And as noted earlier, the NAM Nest tends to overdo orographic precip due to a very sharp topography field that was put in to enhance winds over terrain. That's just a few things off of the top of my head.
- 124 replies
-
- 13
-

-

-
2% TOR and 5% WIND for much of the area in the new Day 2 outlook. Probably not enough sfc-based instability to take advantage of the intense shear, but the threats are certainly non-zero.
- 1,378 replies
-
- 3
-
-
- severe
- thunderstorms
- (and 2 more)
-
We might actually get a good amount of rain (Wednesday night into early Thursday) AND have it hit 70 around midday Thursday.
-
As I noted in the other thread, we need to keep an eye on Thursday. There is growing model agreement that we'll enter the warm sector in the morning and clear out a bit, after the widespread warm advection rains and convection exit to the northeast. There will likely be some scattered convection from late morning into the early afternoon along the occluded front, and it will be in a strongly-sheared environment. The question is how warm we get. It's tough to destablize here in late October, and we'll need really warm surface temps to overcome lousy lapse rates. It will get very warm in southeast VA and the southern Eastern Shore, but will that really warm air be advected this far north? So far, the experimental RRFS is the most aggressive, with temperatures reaching 70 in DC and an area of 750-1250 surface-based CAPE covering much of the area.
- 1,378 replies
-
- 8
-
-
-
- severe
- thunderstorms
- (and 2 more)
-
Some sneaky severe potential Thursday midday or early afternoon as we enter the warm sector. At the least, some elevated convection late Wednesday night into Thursday morning seems likely.
-
Pleasantly surprised to see some lighting strikes over northern Virginia
-
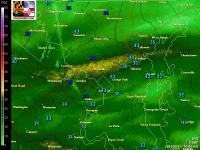
MRGL for most of the area which seems fair. Guidance is now in very good agreement that a strongly-forced, narrow line of heavy showers will race across the area during the evening: 9pm or so in the western burbs, 10pm in the DC-Baltimore area, and over the Bay by around 11. Wind fields are intense with some low-level shear, but instability will be negligible. Lightning therefore seems unlikely, and while winds will be gusty, severe gusts will be difficult to achieve. That said, I still can't completely rule out lightning or a few higher end gusts, and it's also possible that we end up with a tornado warning for someone for a brief couplet.
- 1,378 replies
-
- 10
-
-

-
- severe
- thunderstorms
- (and 2 more)
-
Your timing is off. The image you showed is for 9pm. Guidance has the line reaching the Bay by 11pm.
-
We're now into the range where we can start to see what this looks like in terms of hi-res simulated reflectivity. Both the NAM Nest and HiResW FV3 at 60 hours have an intense line to our west. We'll need a speed-up to boost severe potential locally, but a strongly-forced convective line will likely cross the entire region after dark. Any severe threat, or even lightning potential, will be low due to a loss of diurnal instability, but the dynamics will ensure that both threats are non-zero. And again, if this speeds up by 3-6 hours, the threats for lightning and severe will ramp up accordingly.
- 1,378 replies
-
- 4
-
-
- severe
- thunderstorms
- (and 2 more)
-
Tough to do severe here (from non-TC events) in mid October, but Sunday evening has some potential, especially if we look at the ECMWF solution of a deepening surface low over western PA. Instability is always a limiting factor at this time of year, and the timing of the system isn’t perfect, but it’s a strong trough with good wind fields.
- 1,378 replies
-
- 4
-
-
-
- severe
- thunderstorms
- (and 2 more)
-
The return of the elusive Nor'easter. Drought buster or bust?
high risk replied to dailylurker's topic in Mid Atlantic
Seems to be setting up a regional model vs global model battle. Good to see multiple CAMs in the 00Z suite give much of us at least 0.5" out of this event. -
The return of the elusive Nor'easter. Drought buster or bust?
high risk replied to dailylurker's topic in Mid Atlantic
Definitely a camp of solutions that has a bit of a SW--> NE strung-out low solution for Sunday instead of a consolidated storm along the coast. -
The return of the elusive Nor'easter. Drought buster or bust?
high risk replied to dailylurker's topic in Mid Atlantic
If you had said that the models had major disagreement and inconsistency all week, you would have been correct. But you wrote that the "models had nothing about this until now". That is spectacularly and embarrassingly wrong. You can read discussion about this being a legitimate threat in the medium range as far back as Monday.- 315 replies
-
- 11
-
-
-

-
-
The return of the elusive Nor'easter. Drought buster or bust?
high risk replied to dailylurker's topic in Mid Atlantic
That isn't even remotely true. -
Small line of showers, seemingly right along the front. Winds have really picked up.
-
I don't consider that the "local area", but to each his own. Western MD has been consistently proved to get a significant rainfall from this event, and it has played out. The model QPF for the DC-Baltimore corridor is notably less, but there will be a corridor that jackpots over 0.50". Let's hope that ends up being a wide corridor. edit: and OF COURSE, the NAM Nest comes in way wetter for everyone within seconds after I type my comment......
-
We need to set reasonable expectations for overnight. A number of CAMs suggest that there will be a narrow WSW-ENE swath of just over 0.50" somewhere between Alexandria and Baltimore, but much of the local area will be fortunate to see 0.25".