

CPcantmeasuresnow
-
Posts
2,126 -
Joined
-
Last visited
Content Type
Profiles
Blogs
Forums
American Weather
Media Demo
Store
Gallery
Everything posted by CPcantmeasuresnow
-

December 2020 General Discussions & Observations Thread
CPcantmeasuresnow replied to bluewave's topic in New York City Metro
These are the top 20 storms in NYC, with the storms of the 2000's highlighted in red. Amazing how they have filled the top ten in the last 20 years. To get on the list this storm would have to exceed 15.2 inches in Central Park. I'd love to see it happen but doubting it does. More realistic is the 11.3 inches I keep touting so the 30 year average gets to 30 inches for the Jan 1991 to Dec 2020 calculations to come out next month. It would be nice to get both but I'll take the 11.3 and hope for the top 20 after that. Of course the way they measure in the Park we may not know final totals until early Friday morning, after settling and compression takes its toll.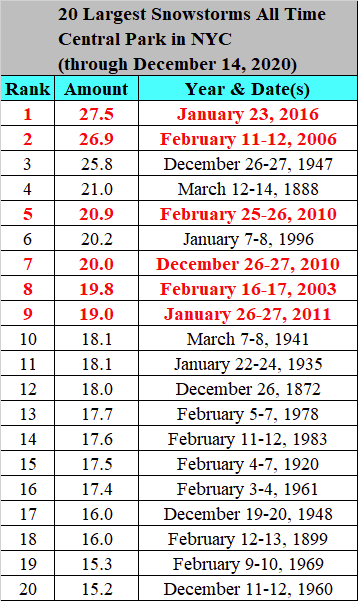
-
Yet you still received 28 inches and I got 35 inches. That's one of the things that made it even more remarkable. Throw in that Boston received mostly if not all rain from that storm.
-
Well that is triple what the GFS gave you three runs ago. Six more runs at that rate and your at 27!
- 3,764 replies
-
- 2
-

-

-
- heavy snow
- heavy rain
- (and 3 more)
-
35 inches from the February 2010 storm, my best of all time, followed closely by January 1996 at 33 inches. Yes I was that guy across the river with 30 plus. I did feel your pain but reveled in the glory nonetheless.
-
Make sure you bring a yard stick and a camera. Central Park needs 11.3 inches of snow this December to get the 30 year average to 30 inches. Don't let them under measure it as is often the case.
- 3,764 replies
-
- 1
-
-
- heavy snow
- heavy rain
- (and 3 more)
-
I would never accept that, unless we in the N&W/N&E sub forum were allowed to then conquer and annex the southern New England Forum into the NYC forum. We must keep a balance, there's already to many south of I78ers here., and I don't like their climate.
-
I think I'll be parked here until Friday morning. Venturing into any other sub forums once the feeding frenzy, kuchera maps, and model preferences begin is not good for the psyche. With that said go Euro, you're the man (or woman)
-
At this stage you can pretty much know within 20 miles of where someone is located just by which models they are siding with and what direction they are praying for the next model runs to go.
- 3,764 replies
-
- 2
-
-
- heavy snow
- heavy rain
- (and 3 more)
-
Below are the 65 largest storms recorded in NYC (Manhattan in this case) since 1870. Storm totals have to be 10 inches or greater to get on this list. There have been 15 storms of 10 inches or greater since 2000. Many of these would not be on Walts list as they overlap midnight. Walt's list is for snowfall in a 24 hour calendar day. 65 Largest Snowstorms All Time Central Park in NYC (through December 14, 2020) Rank.Amount..Date 1……..27.5…..January 23, 2016 2……..26.9…..February 11-12, 2006 3……..25.8…..December 26-27, 1947 4……..21.0…..March 12-14, 1888 5……..20.9…..February 25-26, 2010 6……..20.2…..January 7-8, 1996 7……..20.0…..December 26-27, 2010 8……..19.8…..February 16-17, 2003 9……..19.0…..January 26-27, 2011 10…..18.1…..March 7-8, 1941 11…..18.1…..January 22-24, 1935 12…..18.0…..December 26, 1872 13…..17.7…..February 5-7, 1978 14…..17.6…..February 11-12, 1983 15…..17.5…..February 4-7, 1920 16…..17.4…..February 3-4, 1961 17…..16.0…..December 19-20, 1948 18…..16.0…..February 12-13, 1899 19…..15.3…..February 9-10, 1969 20…..15.2…..December 11-12, 1960 21…..14.5…..March 3-4, 1960 22…..14.5…..March 1-2, 1914 23…..14.0…..December 5-7, 2003 24…..13.8…..January 22-23, 2005 25…..13.7…..December 21-22, 1959 26…..13.6…..January 19-20, 1978 27…..13.0…..January 15-16, 1879 28…..13.0…..January 1-2, 1877 29…..12.8…..February 11, 1994 30…..12.7…..February 19, 1979 31…..12.7…..December 15, 1916 32…..12.5…..February 13-14 2014 33…..12.5…..February 7, 1967 34…..12.5…..January 12-13, 1964 35…..12.5…..February 20, 1921 36…..12.0…..December 30, 2000 37…..12.0…..February 9-10, 1926 38…..12.0…..March 15-16, 1896 39…..11.8…..March 19-20, 1958 40…..11.6…..March 18-19, 1956 41…..11.5…..January 2, 1925 42…..11.5…..January 21-22, 2014 43…..11.4…..December 24, 1912 44…..11.4…..February 8-9, 2013 45…..11.2…..December 26, 1933 46…..11.0…..February 3-4, 1876 47…..11.0…..January 24-25, 1905 48…..11.0…..February 4-5, 1907 49…..10.9…..December 19-20, 2009 50…..10.8…..February 4, 1995 51…..10.7…..February 20-21, 1947 52…..10.7…..February 16-17, 1996 53…..10.6…..March 13-14, 1993 54…..10.4…..February 3-4, 1926 55…..10.3…..January 28, 2004 56…..10.2…..April 3-4, 1915 57…..10.0…..April 13, 1875 58…..10.0…..March 2, 1896 59…..10.0…..January 27-28, 1897 60…..10.0…..November 26-27, 1898 61…..10.0…..February 17, 1902 62…..10.0…..January 23-24, 1908 63…..10.0…..January 14-15, 1910 64…..10.0…..February 11, 1933 65…..10.0…..February 10, 2010
- 3,764 replies
-
- 1
-
-
- heavy snow
- heavy rain
- (and 3 more)
-
I mostly dismiss the GFS for this storm but I'd be lying if I said it didn't make me just a little nervous. You hope it's not one of those times one particular model picks up on something a couple of runs before the others. And if it does somehow verify, I will cry real tears.
-
but that wasn't one of the options.
-
No thanks. I'll take the snow with less wind and keep my power. Nothing worse than sitting through a blizzard in a dark cold house.
- 3,764 replies
-
- 3
-
-
- heavy snow
- heavy rain
- (and 3 more)
-
December 2020 General Discussions & Observations Thread
CPcantmeasuresnow replied to bluewave's topic in New York City Metro
Hey Uncle thanks for the input. I believe our differences are due to rounding and how NOAA will handle that I'm not sure. Also I'm calculating December right now as if no snow will fall for the month which will give it a 4.8 inch average for 1991-2020. Here are the averages carried out past the one tenth decimal. I'm assuming they round January down to 8.7 and February down to 10.1. On the other months I'm rounding up and we agree and that accounts for our.differences. As to what NOAA will do who knows. They had the calculation for 1981-2010 incorrect for 4 years at 25.1 inches. I had to e-mail them several times over the course of a year until to their credit they finally checked and corrected their data in March 2014 and posted the average at 25.8. I still calculate 25.9 for that period but I let it go at that point.
-
December 2020 General Discussions & Observations Thread
CPcantmeasuresnow replied to bluewave's topic in New York City Metro
Here's the list since official records began. Many interesting things of note here. As I noted when this discussion began. NYC needs to record 11.3 inches of snow this December to get the December average to 5.2 and thus the 30 year average to 30.0. It may be close and depend on who is working the ruler the next three weeks and how much they really care about accurate snow measurements in Central Park. It's been a very inexact science through the last several decades.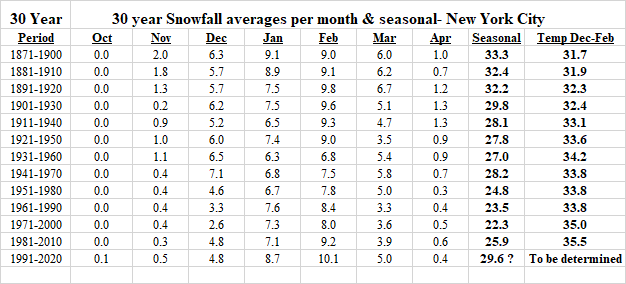
-
December 2020 General Discussions & Observations Thread
CPcantmeasuresnow replied to bluewave's topic in New York City Metro
The answer to that is never. The closest was the period 1891-1920 when the seasonal average was 32.2 inches and February averaged 9.8 inches for that period. The monthly breakdowns for that time period which as stated earlier was the last 30 year period to average more than 30 inches per season was as follows: ......November........December........January..........February...........March.............April................Total..........
-
People now freaking out about the 18z GFS cutoff to the south while we again jackpot. It's crazy how people react run to run. Just to clarify, I was joking when I stated the 12Z Euro made me sick to my stomach. Totally confident and unaffected the whole time
-
I already have a sick feeling in the pit of my stomach.
-
December 2020 General Discussions & Observations Thread
CPcantmeasuresnow replied to bluewave's topic in New York City Metro
I've touched on this subject quite a bit the last two years, but now that we're down to the last three weeks I thought it would be a good time to review where NYC, Central Park specifically, stands in the quest for a 30 inch snowfall average when the new 30 year averages are calculated next month. For those not aware how it works the 30 year snowfall averages will be calculated for the period from January 1991 through December 2020. In short this will mean say goodbye to the 1980's from the averages, which hold the record as the least snowiest decade recorded. Assuming NOAA calculates the averages for each month by rounding up or down to the nearest tenth of an inch, the months who have their 30 years completed look as follows: October..........0.1 November.....0.5 December.....4.9 (29 year avg) final number to be determined January.........8.7 February......10.1 March............5.0 April..............0.4 May..................T The 30 year average calculated now would be 29.7 inches. To get December to a 5.2 average, or in this case 5.15 which should round up to 5.2, Central Park will need to record 11.3 inches of snow this December, which is what will be needed to get the 30 year average to 30.0 inches. Currently the December 1991 -2020 period averages 4.773 inches which would round to 4.8 and would make the 30 year average 29.6 inches if no snow falls this December. Here's to hoping that if Wednesday is indeed a surprise heavy snowfall for the city, the Conservancy? doesn't measure 11.2 inches and leave us hanging for the rest of the month. -
You're 30 years are off slightly from mine Uncle. February will be 10.1 as they don't add the 3 decade averages and divide by 3, but they add each of the 30 years and divide by 30. February average is 10.147 when done my way which I assume they will round down to 10.1. January is the same, it comes out as 8.740 my way, which again I assume will be rounded down to 8.7 Either way we're close. I'm hoping it happens, if so it will be the first 30 year average above 30 inches in NYC since the 1891-1920 period.
-
December 2020 General Discussions & Observations Thread
CPcantmeasuresnow replied to bluewave's topic in New York City Metro
Oh God I hope not -
I've touched on this subject quite a bit the last two years, but now that we're down to the last three weeks I thought it would be a good time to review where NYC, Central Park specifically, stands in the quest for a 30 inch snowfall average when the new 30 year averages are calculated next month. For those not aware how it works the 30 year snowfall averages will be calculated for the period from January 1991 through December 2020. In short this will mean say goodbye to the 1980's from the averages, which hold the record as the least snowiest decade recorded. Assuming NOAA calculates the averages for each month by rounding up or down to the nearest tenth of an inch, the months who have their 30 years completed look as follows: October..........0.1 November.....0.5 December.....4.9 (29 year avg) final number to be determined January.........8.7 February......10.1 March............5.0 April..............0.4 May..................T The 30 year average calculated now would be 29.7 inches. To get December to a 5.2 average, or in this case 5.15 which should round up to 5.2, Central Park will need to record 11.3 inches of snow this December, which is what will be needed to get the 30 year average to 30.0 inches. Currently the December 1991 -2020 period averages 4.773 inches which would round to 4.8 and would make the 30 year average 29.6 inches if no snow falls this December. Here's to hoping that if Wednesday is indeed a surprise heavy snowfall for the city, the Conservancy? doesn't measure 11.2 inches and leave us hanging for the rest of the month. Any interested parties please check the above numbers. And we wait for the final returns.
-
Sun angle coming into play now. I had to say it just so it's been said. Can we agree that we will all be pleasantly surprised if those words are not uttered again in this forum. I accumulated snow on May 9th last year in the middle of the afternoon. I'm pretty sure the sun was up that afternoon, although with all those clouds and snow impeding visibility who can really be certain.
-
0.9 inches on the board here. 31.8° and down to light snow.
-
32.0° on the nose and yes Rob the flakes are the largest of the season, as the biggest snowfall of the season continues.This may surpass the storm of May 9th, or even the upcoming Met winter, if the October snows lead to a crappy winter theme continues. Officially 0.7 inches on the board.
-
Down to 32.4° with moderate steady snow. Sticking to trees and grassy areas now and looking winter like.

