
40/70 Benchmark
-
Posts
78,836 -
Joined
-
Last visited
Content Type
Profiles
Blogs
Forums
American Weather
Media Demo
Store
Gallery
Everything posted by 40/70 Benchmark
-

“Cory’s in NYC! Let’s HECS!” Feb. 22-24 Disco
40/70 Benchmark replied to TheSnowman's topic in New England
Okay, I'm a dick, you are a dick with reading comp deficiencies. -
“Cory’s in NYC! Let’s HECS!” Feb. 22-24 Disco
40/70 Benchmark replied to TheSnowman's topic in New England
@Ginx snewxThis is from Tuesday...you tell me what my position was/is: What is also evident on Friday night is disturbance #3 entering the fray may by moving into the north plains. The crucial difference here is that shortly after the system descends south of the Canadien border, ridging begins to build over the western COUNS intramountain region. This allows ample room for amplification under the aforementioned PV-block dyad due to the fact that southeast heights decrease as a result of the building western CONUS ridge. Note the decreased amplitude and further east position of the ridge in guidance from Sunday. While this does in fact represent a more favorable ridge placement and intensity for major east coast storms, the fact that it remains marginal in conjunction with increased confluence to the north still implies that a major storm is dubious. There remains plenty of time to maintain vigilance with respect to this major storm potential to end the week -
“Cory’s in NYC! Let’s HECS!” Feb. 22-24 Disco
40/70 Benchmark replied to TheSnowman's topic in New England
@Ginx snewxThis is from Sunday blog: The largest storm potential exists in association with a potential coastal development on Monday, February 23, however, the early indication is that this system is likely to pass predominately out to sea and pose a larger threat to the Canadien Maritimes. -
“Cory’s in NYC! Let’s HECS!” Feb. 22-24 Disco
40/70 Benchmark replied to TheSnowman's topic in New England
You maybe right...like I said, I just listened to his video on the way into the office. My original position was the confluence N of ME and the marginal quality/positioning of the ridge out west. -
“Cory’s in NYC! Let’s HECS!” Feb. 22-24 Disco
40/70 Benchmark replied to TheSnowman's topic in New England
That was my original point. Just saw DT's video on the way in, maybe it's my fault bc I took it out of context or something. -
“Cory’s in NYC! Let’s HECS!” Feb. 22-24 Disco
40/70 Benchmark replied to TheSnowman's topic in New England
I've always been on the OTS train with this. You want links? Let me know how much you end up with. -
“Cory’s in NYC! Let’s HECS!” Feb. 22-24 Disco
40/70 Benchmark replied to TheSnowman's topic in New England
No. Watch DT's video. There is some sort of communication gap that I don't have time to bridge right now. Honest statement...it's not at all a shot at Brian. -
“Cory’s in NYC! Let’s HECS!” Feb. 22-24 Disco
40/70 Benchmark replied to TheSnowman's topic in New England
They are connected. I know for me, understanding what boots it out to sea helps to determine how to get it to snow. -
“Cory’s in NYC! Let’s HECS!” Feb. 22-24 Disco
40/70 Benchmark replied to TheSnowman's topic in New England
Well, whatever...we don't want it to do what the EURO has it doing. -
“Cory’s in NYC! Let’s HECS!” Feb. 22-24 Disco
40/70 Benchmark replied to TheSnowman's topic in New England
Doesn't mean it's correct in doing so. The Euro correctly has that energy kick the developing blizzard out over the ocean. -
“Cory’s in NYC! Let’s HECS!” Feb. 22-24 Disco
40/70 Benchmark replied to TheSnowman's topic in New England
We need the follow up crap over MN to weaken....DT mentioned that and it's a solid point. -
“Cory’s in NYC! Let’s HECS!” Feb. 22-24 Disco
40/70 Benchmark replied to TheSnowman's topic in New England
I think that late January threat after the blizzard is a pretty good analog. -
“Cory’s in NYC! Let’s HECS!” Feb. 22-24 Disco
40/70 Benchmark replied to TheSnowman's topic in New England
Should we do a wellness check? -
“Cory’s in NYC! Let’s HECS!” Feb. 22-24 Disco
40/70 Benchmark replied to TheSnowman's topic in New England
Yea, it's going to be relatively close in a geographical sense....got it, but it seems pretty definitive that we aren't getting a blizzard. Been my take for days and I'm not seeing anything to give me pause. -
“Cory’s in NYC! Let’s HECS!” Feb. 22-24 Disco
40/70 Benchmark replied to TheSnowman's topic in New England
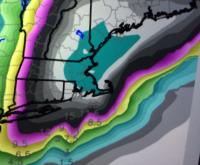
I really fail to see how anyone can take these two images in and be at a loss for where this is headed. -
“Cory’s in NYC! Let’s HECS!” Feb. 22-24 Disco
40/70 Benchmark replied to TheSnowman's topic in New England
That is about what I expect for a track...makes sense. -
You wonder if areas of CT get some ZR that doesn't really freeze....
-
Be careful with NAM QPF....ride it for thermals here, but proceed with caution concerning QPF output.
-
“Cory’s in NYC! Let’s HECS!” Feb. 22-24 Disco
40/70 Benchmark replied to TheSnowman's topic in New England
I wonder if he bothers to ever walk any of this dribble back when mother nature inevitably puts him over her knee? I don't bother to check.... -
“Cory’s in NYC! Let’s HECS!” Feb. 22-24 Disco
40/70 Benchmark replied to TheSnowman's topic in New England
Gonna give this another 24 hours before I really begin to delve in, but I'm still not very enthused. -
“Cory’s in NYC! Let’s HECS!” Feb. 22-24 Disco
40/70 Benchmark replied to TheSnowman's topic in New England
Agree for the most part, but I don't think it will be P sunny here....more like fringe. -
“Cory’s in NYC! Let’s HECS!” Feb. 22-24 Disco
40/70 Benchmark replied to TheSnowman's topic in New England
I wish the energy over MN would dissapear. -
“Cory’s in NYC! Let’s HECS!” Feb. 22-24 Disco
40/70 Benchmark replied to TheSnowman's topic in New England
Looks like Jan 22...lovely. -
“Cory’s in NYC! Let’s HECS!” Feb. 22-24 Disco
40/70 Benchmark replied to TheSnowman's topic in New England
Good post. -
“Cory’s in NYC! Let’s HECS!” Feb. 22-24 Disco
40/70 Benchmark replied to TheSnowman's topic in New England
Notice the only guidance that shifts west are the ones well out to sea?? Then when they get close, they shift back OTS? What does that tell you?


