RodneyS
-
Posts
1,336 -
Joined
-
Last visited
About RodneyS

Recent Profile Visitors
4,841 profile views


-
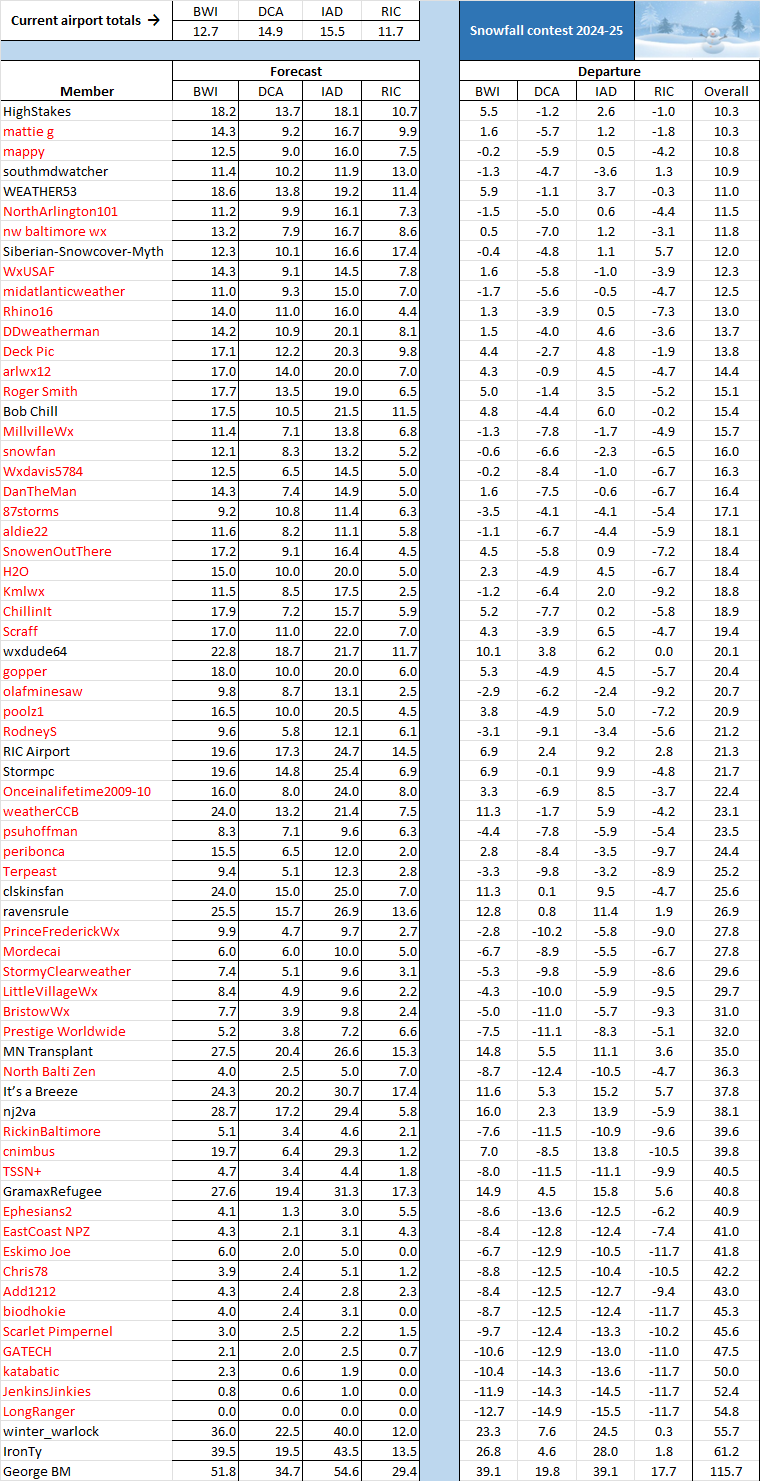
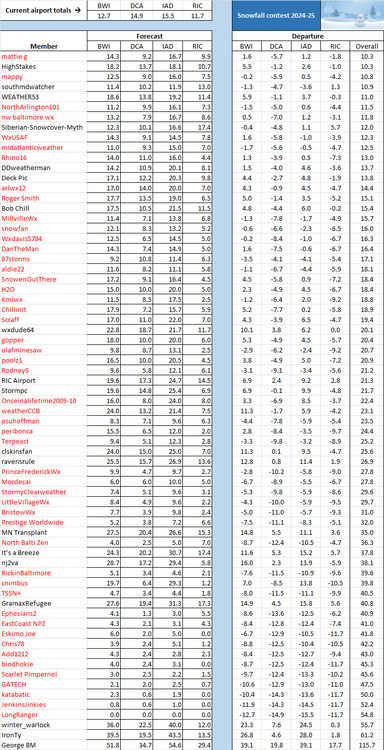
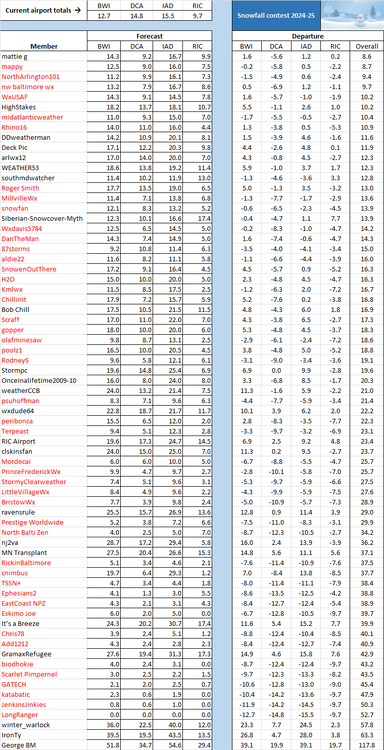
A far more exciting contest this season than the last two, with six lead changes and anticipation in mid-February of a blockbuster storm at the four airports on February 19-20. Unfortunately for snow lovers, the Euro model's Valentine Day's tease of 16.1 inches in DC on those two days was correct only after the decimal point -- the other 16 inches went south. Still, that storm played a crucial role in determining this season's winner. To recap this season's contest, @LongRanger's zero across the board forecast maintained the lead until some early January snow propelled @RickinBaltimore into a brief lead on the 6th of that month. It appeared that @psuhoffmanhad wrested the lead away on the 7th, only to find that downward revisions to RIC's total had instead put @StormyClearweather in front. However, additional snow did eventually put @psuhoffmanin control on January 11th, and he held onto the lead for more than a month. A February 11-12 storm put @mappyinto the lead on the 12th. It was about that time that all of us began hearing about a potentially historic storm in the Mid-Atlantic about a week down the road. But by the time Valentine's Day weekend concluded on February 16th, it was clear that would not happen at BWI, DCA, or IAD, although there was still a possibility at RIC. Even when it became certain on February 18th that the major snow would fall mainly in southern Virginia, there was still a realistic chance of at least 4.3 inches at RIC, which would have put @southmdwatcherin the lead on a tiebreaker. After an early report of 2 inches there on February 19th put @mattie gin the lead, an additional 2 inches at RIC gave the lead to @HighStakes on a tiebreaker with @mattie gat the end of the day. The question then became, would February 20th produce at least another 0.3 inches at RIC? In a word, no, as only a trace fell there on that day. The final question was, would the rest of the 2024-25 winter season produce at least a little more snow? The answer was a ringing no, as the Mid Atlantic turned into Florida North in March. And so, the time has come to award the 2024-25 Championship Trophy to @HighStakeson a tiebreaker over @mattie g. This is only the second tiebreaker in the history of this 11-year-old contest, with the previous one having occurred six years ago, when @olafminesaw edged out @Stormpc. See you in November!

-
March 2025 was the 4th warmest March in DC history, with an average temperature of 54.3 at DCA, exceeded only by 2012 (56.8), 1945 (56.2), and 1921 (55.5). During last year's recordbreaking warm year in DC, March averaged 51.9 at DCA. However, January-March 2025 at DCA was well below last year, at 43.2 vs 45.4. The warmest January-March in DC history was 47.3 at DCA in 2012.
-
DCA _ NYC _ BOS __ ORD _ ATL _ IAH ___ DEN _ PHX _ SEA -0.3 -0.8 -0.1 -2.4 1.1 0.6 -1.3 -0.6 0.8
-
I'm still going to wait until next week to officially close out the contest, but it would take a minor miracle for more snow to fall at any of the four airports, and so your 5th place finish looks assured. You did better at SBY than our top two finishers, and I'm sure that co-leader @mattie gis wishing he had gone with your forecast of 13.8 inches there, instead of his forecast of 8.6 (and our presumptive winner @HighStakesforecast of 10.8). However@IronTyhad his 15 minutes of fame with a nearly dead-on forecast at SBY of 21.5 inches, compared with the actual of 21.3. FYI, @DanTheManhad the best forecast at LYH of 11.0 inches, compared with an actual of 12.4.
-
The 2024-25 astronomical and composite winters were each much cooler than last season at DCA. The former averaged 41.1 degrees, tied for the 29th warmest in DC history and down 4.1 from last year; while the latter averaged 41.3 degrees, tied for the 27th warmest in DC history and down 3.8 from last year.
-
Are you saying that because you can recall April 1938, Roger? Actually, there was only a trace of snow in DC then, after an average March temperature of 49.8 degrees. However, I can recall a stunning Mid-Atlantic turnaround that occurred much more recently. March 1990 at DCA averaged 50.2 degrees, and featured these maximums during March 12-16: 89/87/86/81/81. The Mid-Atlantic winter was over, right? Not so fast. During March 20-April 7, 1990, BWI received 2.8 inches of snow, DCA received 2.6 inches, RIC received 0.2 inches, and IAD received -- would you believe -- 10.4 inches? Moreover, each airport received measurable snow on either April 6th or 7th, with IAD checking in at 2.7 inches on the 6th and 1.1 inches on the 7th.
-
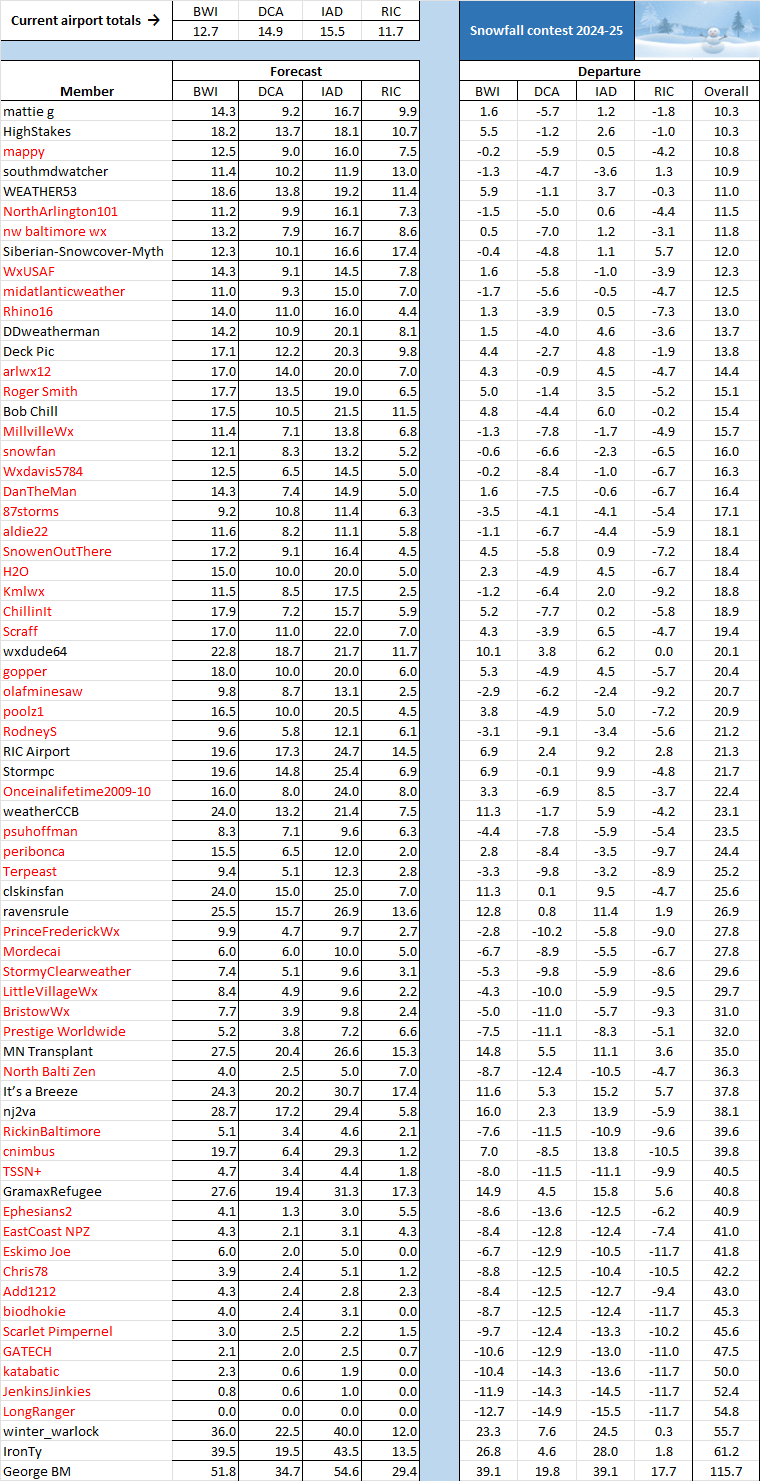
The Capital Weather Gang has declared winter over in DC, and they have a good track record of not doing so until the last measurable snow has fallen in these parts; see https://www.washingtonpost.com/weather/2025/03/10/winter-over-spring-starts-dc. While I will not award the 2024-25 trophy until at least April 1st, things are looking good for @HighStakes. Even if a little more snow falls at any of the four airports, it will likely be at BWI or IAD, where he can still improve. @southmdwatcherhas some hope, but only if RIC can eke out at least 0.3 inches, with little or no snow at the other three airports. Under a 0.3 at RIC and zero at the other three airports scenario, he, HighStakes and @mattie g would each finish with a departure of 10.6, and he would win a three-way tiebreaker. However, the far more likely scenario is a two-way tie between HighStakes and mattie g, with HighStakes winning the tiebreaker with his closer forecast at SBY.

-
DCA _ NYC _ BOS __ ORD _ ATL _ IAH __ DEN _ PHX _ SEA 0.4 0.7 0.6 1.1 -0.4 2.1 0.5 -0.3 -0.2
-
February 2025 at DCA ended warm, bringing the average temperature to 41.0 degrees -- tied for the 34th warmest February in DC history. That brought the 2024-25 meteorological winter (December, January, and February) average to 39.0 degrees -- tied for the 43rd warmest in DC history. Nonetheless, the 2024-25 DCA meteorological winter was the coldest in 10 years -- surpassing every winter for cold since the 2014-15 winter averaged 36.7 degrees. The historical average for all 154 DC winters since recordkeeping began in 1871-72 is 37.1 degrees.
-
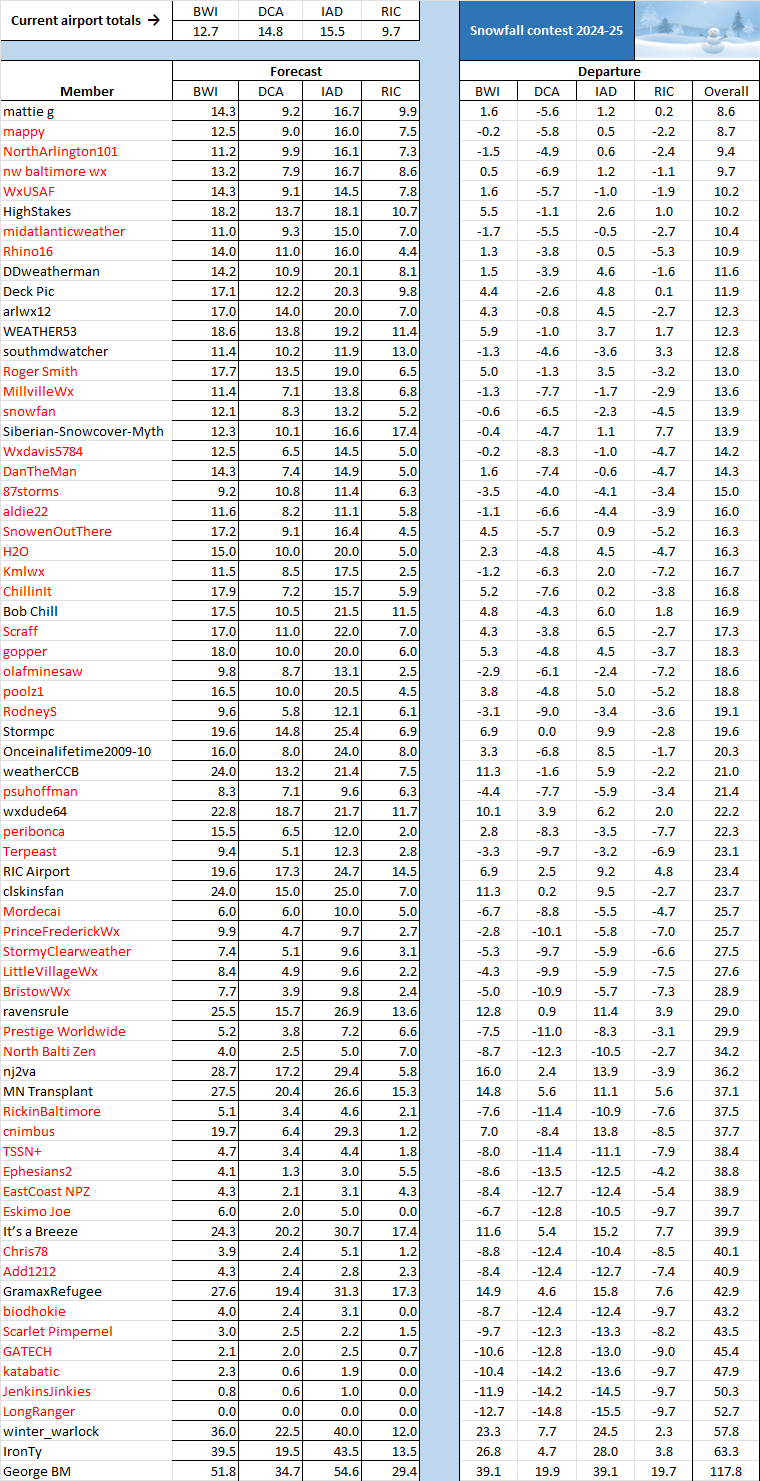
FYI, each of the four airports recorded only a trace of snow today. However, I am updating the table to show that -- barring corrections to the snow totals -- two more contestants have been eliminated from contention, to bring that total to 50 (in red), leaving only 19 who still have a chance to win. Most stunningly, I have determined that co-leader @mattie g has bitten the dust. Why is that? Because while he could still finish in a first-place tie with @HighStakes, he would lose the tiebreaker based on his forecast of 8.6 inches of snow at Salisbury (SBY) vs High Stake's forecast of 10.8 inches there. Because SBY has already recorded 17.8 inches this season, mattie g is history -- just as the other 49 of us are.
-
Thanks - - see updated table below, which also includes another 0.1 at DCA:

-
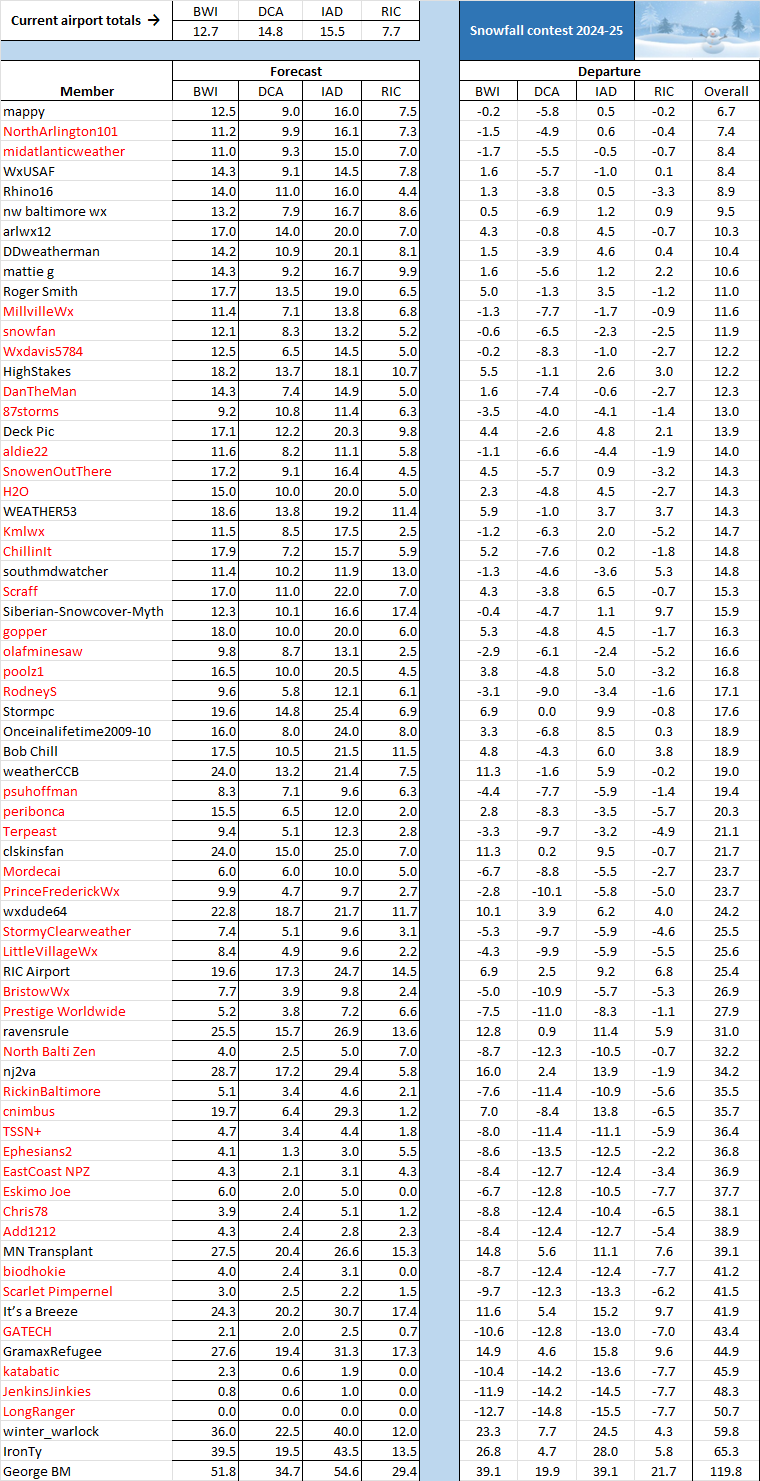
We have a new leader, as RIC has already recorded 2.0 inches today. That puts @mattie gin first place, with @HighStakesa big threat to move into a tie before day's end and @southmdwatcherlurking if RIC records several more inches.
-
Yes, and this season may make it 15 times. By the way, the largest amount by which DCA snow exceeded BWI snow was 5.5 inches in 1979-80 -- 20.1 inches at DCA, 14.6 at BWI. On the other hand, the largest amount by which BWI snow exceeded DCA snow was 20.9 inches in 2009-10 -- 77.0 inches at BWI and 56.1 inches at DCA. Both totals were record-breakers for any year in Baltimore and DC dating back to the 1880s, and the BWI total even exceeded IAD's record-breaking total of 73.2 inches that memorable snow season 15 years ago.
-
DCA became the official DC weather location in July 1945, and BWI began operations in June 1950. Thus, winter season comparisons between the two airports begin in 1950-51, and so there are now 74 winter season comparisons in the books. During those 74 seasons, DCA has averaged 15.5 inches of snow, and BWI has averaged 19.8 inches, with BWI snow exceeding DCA snow 58 times, DCA snow exceeding BWI snow 14 times, and two seasons ending in a tie.
-
Thanks. What I was going by was Wednesday's daily report for DCA issued at 12:35 AM this morning, which may be found at "Observed Weather" "Daily Climate Report" for "Washington-National" at https://www.weather.gov/wrh/Climate?wfo=lwx. The newest version is currently for Thursday, but you can find the 12:35 AM version for Wednesday by clicking "2" at the top (in blue). It's head-scratching how these contradictions occur, but you are correct that the snow total for yesterday is now back up to 0.5 inches. The below table reflects that change for DCA: