BlizzardWx
-
Posts
446 -
Joined
-
Last visited
About BlizzardWx

Recent Profile Visitors


-
2026-2027 Super El Nino
BlizzardWx replied to Stormchaserchuck1's topic in Weather Forecasting and Discussion
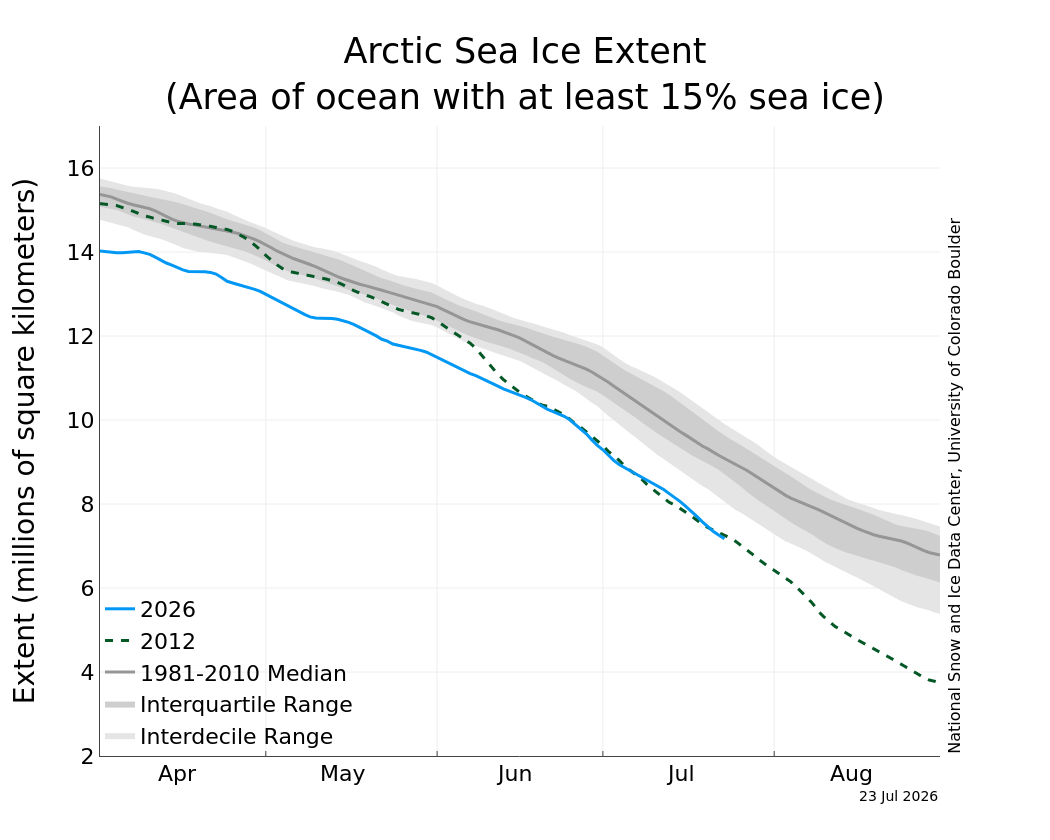
Somebody had made a comment on the cold 80+ N area the other day, but worth noting that sea ice continues to remain near record lows for the date.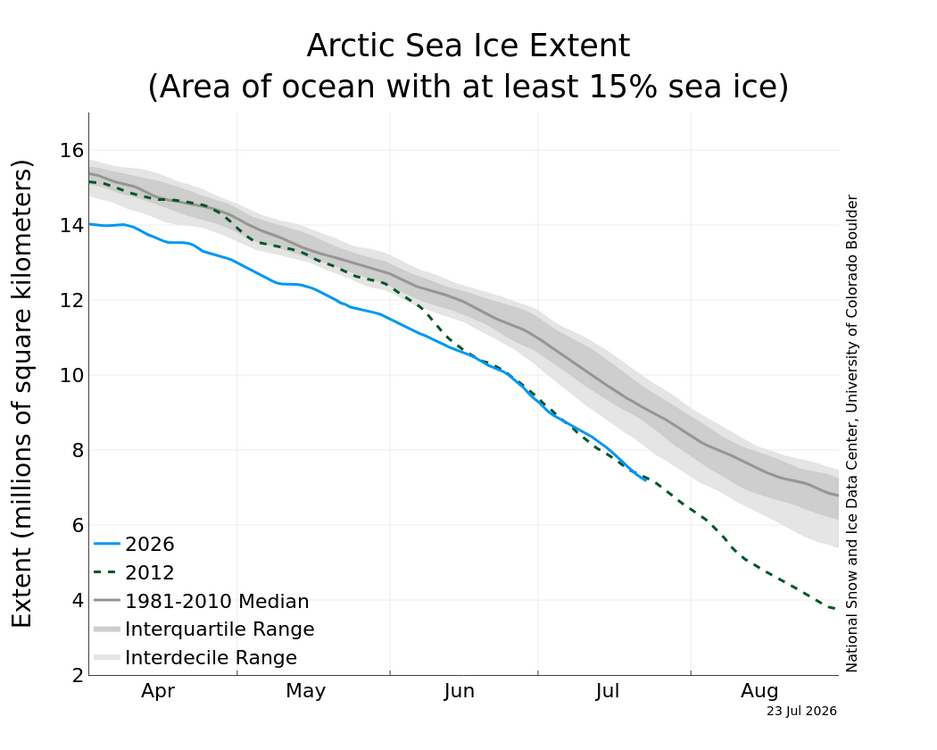
-
2026-2027 Super El Nino
BlizzardWx replied to Stormchaserchuck1's topic in Weather Forecasting and Discussion
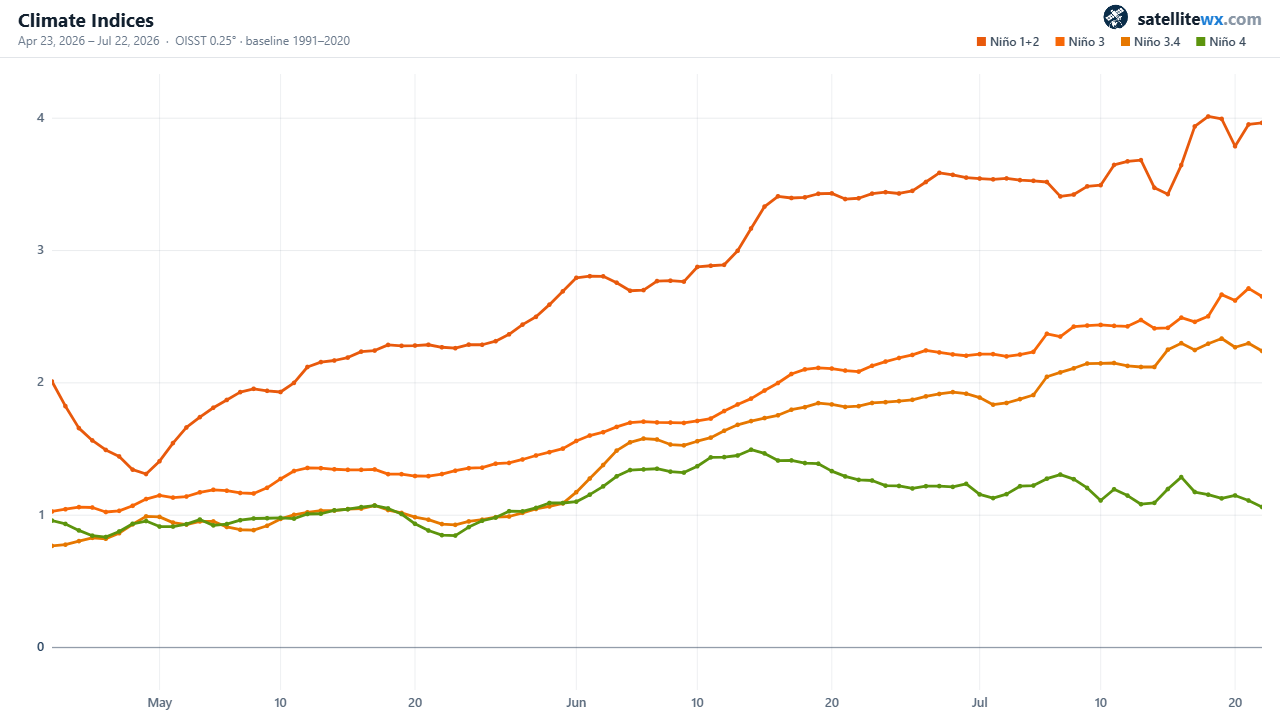
Recent trends of all the nino regions together. You can really see nino 4 leveling off while the others continue to build.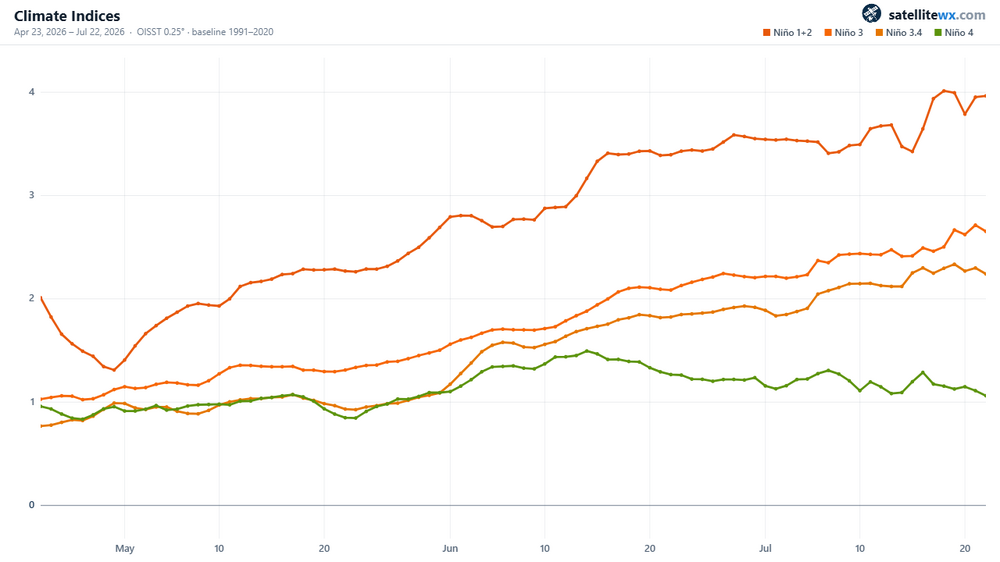
-
2026-2027 Super El Nino
BlizzardWx replied to Stormchaserchuck1's topic in Weather Forecasting and Discussion
In fact, I think that the odds of this changing into fall are pretty good. At some point the el nino pattern may just break in as tropics and midlatitude better connect with time. -
2026-2027 Super El Nino
BlizzardWx replied to Stormchaserchuck1's topic in Weather Forecasting and Discussion
I've been thinking about this too. Makes you wonder if with CC what is typical of el nino could be changing or if we've just been oversubscribing a small sample size. Either one says we aren't necessarily going to get a big GOA low. It also says maybe the El nino - PDO connection is less settled than we think. -
2026-2027 Super El Nino
BlizzardWx replied to Stormchaserchuck1's topic in Weather Forecasting and Discussion
I think stuff like this is where past analogs could fall short. This basically has never happened, so while I wouldn't say past analogs have no utility we have to be careful to not oversubscribe what we know. We may well see equatorial convection further east than has ever been seen, and so forcing will be uniquely far to the east as well. My comment isn't being directed at you btw, just in general, a caution for all. -
2026-2027 Super El Nino
BlizzardWx replied to Stormchaserchuck1's topic in Weather Forecasting and Discussion
That is certainly the way it looks. Yeah, some MC influence is still lingering, but the nino obviously still has a lot of room to run too. It'll clearly be improved over 2023. And like you said that is what actually matters for this year. -
Texas 2026 Discussion/Observations
BlizzardWx replied to Stx_Thunder's topic in Central/Western States
Certainly feeling like summer out there now. MCS expected tonight through the Tulsa area, but hopefully after fireworks. -
2026-2027 Super El Nino
BlizzardWx replied to Stormchaserchuck1's topic in Weather Forecasting and Discussion
And it's not going to stop either. Both sides of the Pacific are going to stay active into fall, and El Nino is going to keep on rolling as continuous WWBs push it to full throttle. -
2026-2027 Super El Nino
BlizzardWx replied to Stormchaserchuck1's topic in Weather Forecasting and Discussion
For all the talk of the arctic being cold, the sea ice hasn't got the memo, running near record lows. What I suspect, if the "cold" pattern continues, is that this will slow down heading into peak summer melt season like we've seen in the last few years. So we end up low, but not record low. On the other hand if melt off continues it would be yet another sign that something has indeed shifted.
-
2026-2027 Super El Nino
BlizzardWx replied to Stormchaserchuck1's topic in Weather Forecasting and Discussion
I think extra cloud cover from more open sea area and thus evaporation is a good candidate. But its also plausible it could be traced back to the same patterns driving the west Pacific warm pool/-PDO that has been dominant over most of this same period. Interesting to think about anyway. I am not totally sure we cool that area below 30C but it is possible. Perhaps more likely is if the area to the east is enough warmer, along with the circulation you mentioned, it can at least put a lid on convection near the MC. Then you'd at least have the dominant forcing away from 4-5-6. -
2026-2027 Super El Nino
BlizzardWx replied to Stormchaserchuck1's topic in Weather Forecasting and Discussion
I think it IS pretty good right now for the most part. But I also think as the globe warms it will rise. It's really a function of lapse rates and a 30C surface is usually good enough to guarantee conditional instability for the time. But this ties back to my other post that a robust +IOD and +ENSO circulation could still cap it. -
2026-2027 Super El Nino
BlizzardWx replied to Stormchaserchuck1's topic in Weather Forecasting and Discussion
That is the question! I hope we can do it but I am still on the fence about whether it happens or not. -
2026-2027 Super El Nino
BlizzardWx replied to Stormchaserchuck1's topic in Weather Forecasting and Discussion
Yeah that is exactly what I was getting at. I am not sure if +30C is a magic number per say, as strong enough subsidence from a +IOD and +ENSO circulation might be able to keep a lid on it. But I do think the general idea is correct that if the surface is warm enough you will still get storm activity and forcing from that area. -
2026-2027 Super El Nino
BlizzardWx replied to Stormchaserchuck1's topic in Weather Forecasting and Discussion
If the entire system is too warm, even "below normal" can still be warm enough for convection to form. I tend to think that is what actually matters. If storms are popping near to above normal frequency near the MC you still have forcing. -
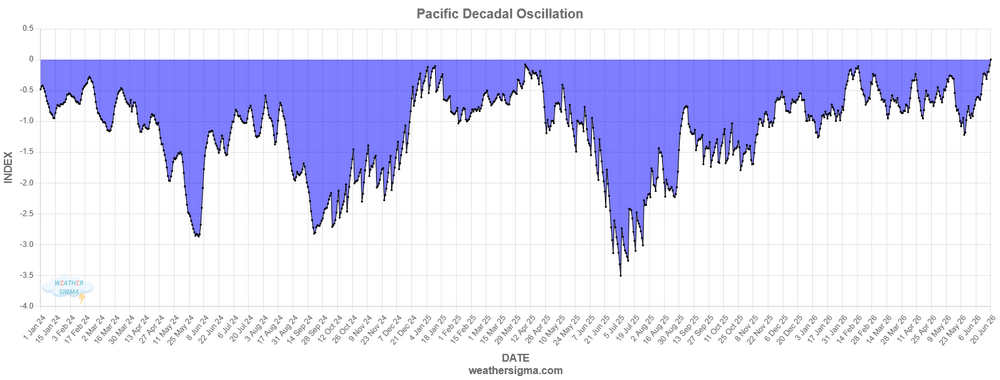
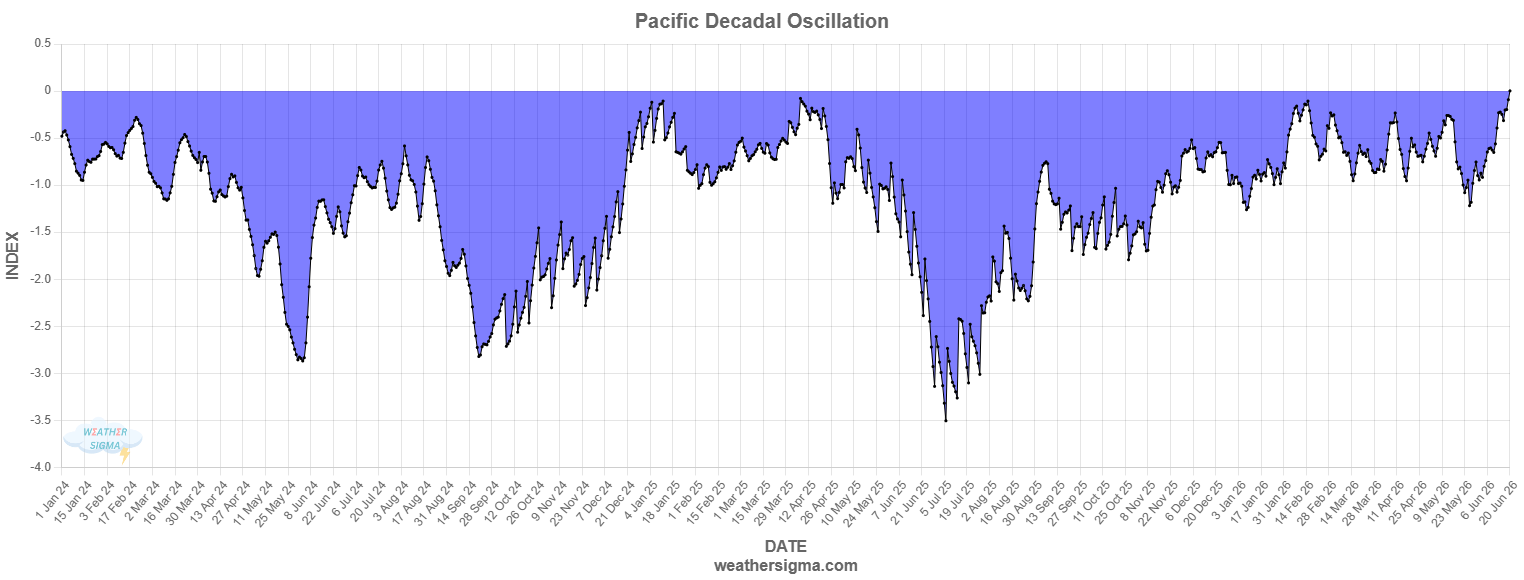
2026-2027 Super El Nino
BlizzardWx replied to Stormchaserchuck1's topic in Weather Forecasting and Discussion
My numbers run slightly higher than WCS, and showing a rise back to around 0. Last year at this time we were tanking the value. In 2024 we were recovering somewhat after already tanking, but values were still much lower than now. In my mind its clear that things are really changing from where we've been the last 10 years. Yeah, maybe we aren't headed for a robust +PDO, but it feels like neutral to slightly positive could be in the cards.