All Activity
- Past hour
-
Yaakov, Fwiw, the data driven April 2025 Euro forecast for 2025 has just a near normal CONUS risk vs an enhanced risk in the April of 2024 forecast for 2024: This was April of 2024: look at all of that red concentrated along the US coasts/in Gulf: Here’s April of 2025: no red…just mainly near normal
-
Nasty afternoon to be on the south shore.
-
Notice how wide the band of +PDO SST warming was from Mexico all the way to Alaska with the +PDO super El Niño event in 15-16. It far surpassed anything we have ever seen from a +PDO and El Niño combo before. The reason the raw index you posted was underdone was due to the much smaller cold pool to the west of the +PDO horseshoe. So the footprint of the historic +PDO was larger leading to the normally cold regions to the west being smaller. This why the SST charts below are a better indicator of the strength of the event. As the raw index was too narrowly defined to capture the sheer volume of historic SST warmth near the coast. So we need to update the way we calculate these indices in a rapidly warming world with more extreme marine heatwaves. We have seen this same process at work with the raw telconnections struggling to capture the totality of events which have more often been defined by the record 500mb heights.


-
80 degrees + days at EWR :4. With Today should get to 5.
-
Records: Highs: EWR: 91 (1974) NYC: 89 (1974) LGA: 88 (2017) JFk: 85 (2017) Lows: EWR: 35 (1947) NYC: 32 (1874) LGA: 39 (1977) JFK: 36 (1968) Historical: 1905 - The town of Taylor, in southeastern Texas, was deluged with 2.4 inches of rain in fifteen minutes. (The Weather Channel) 1910 - The temperature at Kansas City, MO, soared to 95 degrees to establish a record for the month of April. Four days earlier the afternoon high in Kansas City was 44 degrees, following a record cold morning low of 34 degrees. (The Weather Channel) (The Kansas City Weather Almanac) 1963 - A tornado, as much as 100 yards in width, touched down south of Shannon, MS. The tornado destroyed twenty-seven homes along its eighteen mile path, killing three persons. Asphalt was torn from Highway 45 and thrown hundreds of yards away. Little rain or snow accompanied the tornado, so it was visible for miles. (The Weather Channel) 1973 - The Mississippi River reached a crest of 43.4 feet, breaking the prevous record of 42 feet established in 1785. (David Ludlum) 1987 - A storm off the southeast coast of Massachusetts blanketed southern New England with heavy snow. Totals of three inches at Boston MA, 11 inches at Milton MA, and 17 inches at Worcester MA, were records for so late in the season. Princeton MA was buried under 25 inches of snow. (The National Weather Summary) (Storm Data) 1988 - Thunderstorms produced large hail and high winds in central Texas. Baseball size hail was reported at Nixon, and wind gusts to 70 mph were reported at Cotulla. Heavy rain in Maine caused flooding along the Pemigewassett and Ammonoosuc Rivers. (The National Weather Summary) (Storm Data) 1989 - Thunderstorms produced severe weather in Arkansas, Louisiana and eastern Texas, with more than 70 reports of large hail and damaging winds. Softball size hail was reported at Palestine TX. Hail as large as tennis balls caused ten million dollars damage around Pine Bluff AR. (The National Weather Summary) (Storm Data) 1990 - A storm system crossing northern New Mexico blanketed parts of the Rocky Mountain Region and the Northern High Plains with heavy snow, and produced blizzard conditions in central Montana. Much of southern Colorado was buried under one to three feet of snow. Pueblo tied an April record with 16.8 inches of snow in 24 hours. Strong canyon winds in New Mexico, enhanced by local showers, gusted to 65 mph at Albuquerque. Afternoon temperatures across the Great Plains Region ranged from the 20s in North Dakota to 107 degrees at Laredo TX. (The National Weather Summary) (Storm Data)
-
Thanks for posting the S&P outlook, Barry. Very interesting! One of the few *data-driven* (not totally qualitative) landfall risk outlooks I have seen. Their maps seem to suggest higher than usual activity in the central Atlantic portion of the MDR (around 40-60W) and the Bahamas area (off FL coast) as well as the Caribbean and GOM.
-
58 / 42 and on the way to 80 / mid 80s in the warmer spots, perhaps some 87's. A bit cooler to the 70s on Wed then near 70 on Thu before the front approaches. Will it be cutoff city 5/2 -5/7 with clouds, onshore and unsettled or will the cutoff setup east or north of here. Either way that will be the focus of the period 5/2 - 5/6 which could also be near normal / drier. Next shot of rain between Fri - Sun 0.50 or more now forecast. Overall near normal as it stands now the first week of the month.
-
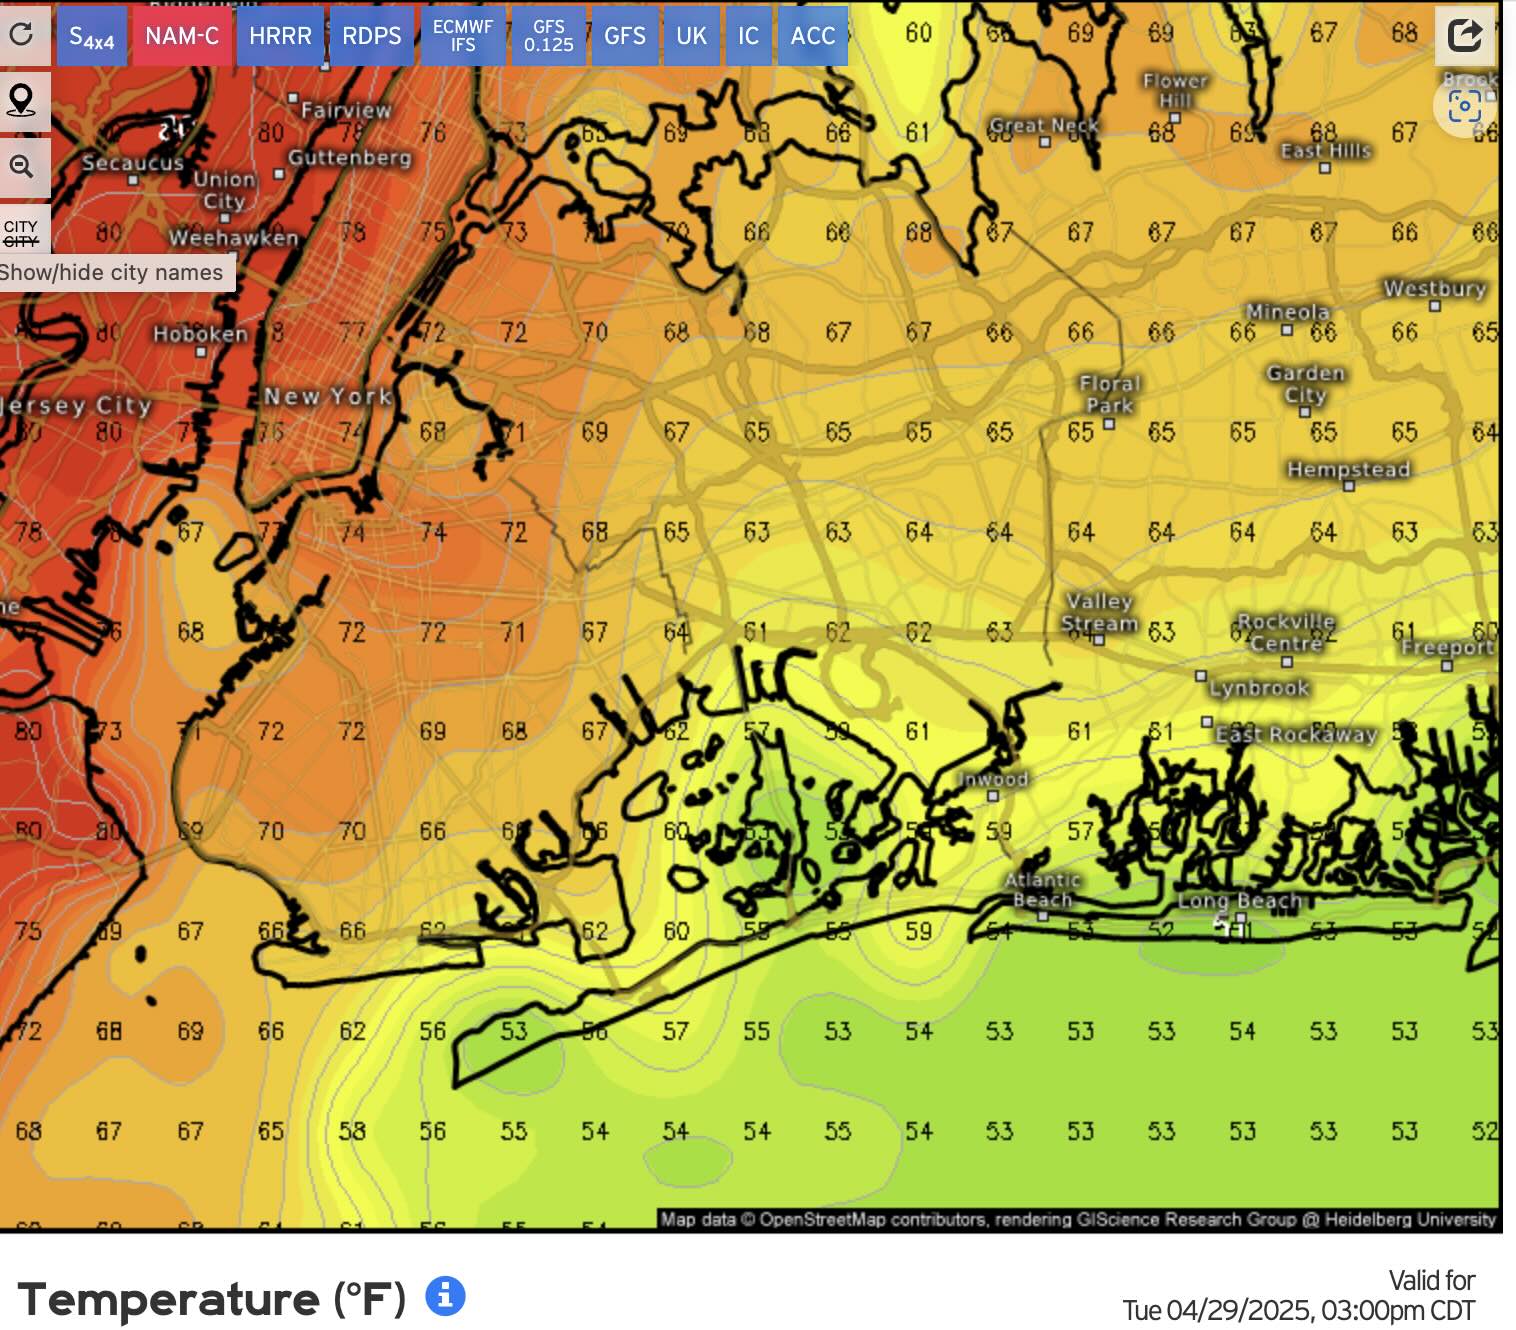
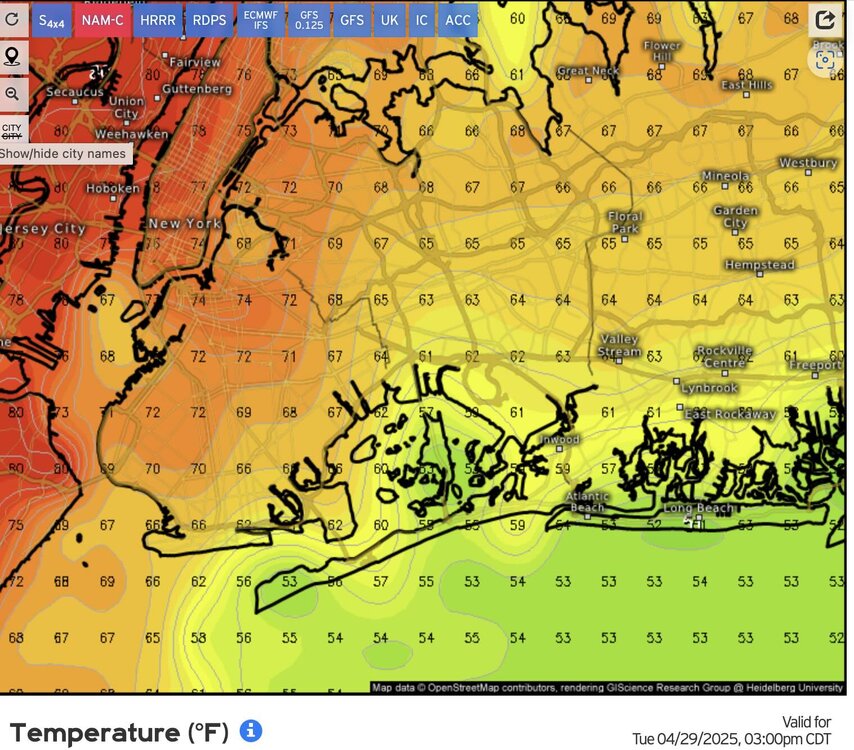
Quite the gradient this afternoon on the 3K NAM:
-
1. But the SSTs along the W coast are just a portion of the entire PDO calculation. Just looking at the W coast like you did seems more narrow to me. 2. The SSTs in 2014-5 being at the warmest on record (per what you said) aren’t surprising due to global warming. And again, the full PDO calculation also involves other areas.
-
54F overnight low. Almost close to opening a window
-
ready for more wind
-
Almost 10 degrees warmer this morning, currently 46.5/41.8 at 8 am.
-
Stayed in the 70s through 3am, but have since dropped back into the 50s with gusty westerlies. Picked up 0.00" rain overnight.
-
Another beautiful spring morning followed by fropa and plummeting temps with a stiff NW wind by noon. Wish we could get more than a day or two of nice weather before the bottom falls out.
-
The SSTs along the West Coast were the warmest on record during the 2014-2015 +PDO event. Those raw indices values you posted were only a small piece of the total event. As those raw indices can often miss the totality of events. Like we often see between the 500mb versions of the teleconnections and the surface pressure versions. My analysis involves a bigger picture view rather than the more narrowly defined approach that you are taking. Notice how much wider the band of record SST along the West Coast warmth was in the 15-16 event than 97-98 and 82-83.


-
1. Regarding the top bolded, there was a record strong El Niño ~2015 (per ONI) and a strong accompanying +PDO. However, the +PDO portion of the couplet wasn’t near a record: -2015 PDO: +0.9 This was similar to the strong El Niño/+PDO couplet of the late 1950s. But all of these years had a stronger +PDO: -1997 +1.3 -1993 +1.0 -1986 +1.0 -1987 +1.1 -1983 +1.2 -1941 +2.3 -1940 +1.8 -1936 +1.9 -1931 +1.0 -1926 +1.8 -1905 +1.4 -1904 +1.2 -1902 +1.2 2. Regarding the 2nd bolded section, that +PDO ended July of 2016. Then it went back and forth through June of 2017. So, I’m calling that 12 month period neutral. After that, I’m calling it overall modestly negative July of 2017 through 2019 before the strong -PDO took over. https://www.ncei.noaa.gov/pub/data/cmb/ersst/v5/index/ersst.v5.pdo.dat
-
WWLT Min 38
- Today
-
link?
-
-I’m not concluding/predicting where the OHC will be come hurricane season. I’m just showing how it looks as of April 16th vs other years. -I’m showing the area east of the Caribbean because it was so incredibly warm last year and has cooled so much since then as JB has been emphasizing recently almost every day. -Indeed, the Caribbean and Gulf are also very important regarding OHC. They’ve also cooled though not as dramatically. The subtropics are also important though this section doesn’t have OHC for it as it is a tropical waters section. Cheers
-
You can see the difference between Hazleton and Allentown in my latest trucking video. As I mentioned in my Facebook post, the grass along I-81 was still mostly dormant, and the trees were bare at the well. Down in Allentown, most everything was green and blooming/leafing out.
-

Central PA Spring 2025
Mount Joy Snowman replied to canderson's topic in Upstate New York/Pennsylvania
53 at the house and 46 through the rurals. Beautiful days ahead. -
Pretty good agreement across guidance on Saturday rain. After that solutions diverge.
-
Big Ambrose Jet day coming up. 80s west of the sea breeze to 50s along the South Shore. Then SSW gusts later over 30 mph again. So our strong winds pattern continues.


-
My point was about the duration of the PDO cycling. I have posted numerous papers further back on how the length of the phases was different during different climate epochs. The period around 2015 was one off the most extreme +PDO and super El Niño couplets that we have ever experienced. I posted papers on this further back on how there was a model used which forecasted this shift. But the amplitude of the shift in the model was much weaker than what verified. So the period from around 2015 to the late 2010s was indeed a +PDO phase. But we cycled back to more -PDO into the 2020s. There was more research that the ENSO cycle has become more extreme using corals going back hundreds of years as the climate has warmed. This has been confirmed by how extreme the swing was between the super El Niño and +PDO was in 2015 and the -PDO and multiyear La Niña -PDO in the early
-

Spring 2025 Medium/Long Range Discussion
Spartman replied to Chicago Storm's topic in Lakes/Ohio Valley
ILN wants to talk about a blocking pattern developing this weekend into next week .LONG TERM /WEDNESDAY NIGHT THROUGH MONDAY/... A robust short wave moving out of the Ozarks on Thursday will deamplify as it lifts up the Ohio Valley on Thursday night. At the surface, a warm front will lift across the region Wednesday night and there could be some showers and thunderstorms associated with that. Potential for showers and thunderstorms in the warm sector will increase with the combination of diurnal heating and the approach of upper support. Activity will wane somewhat as the short wave lifts away from the area later Thursday night. The short wave will take a surface low west and north of the region, but a trailing cold front will slide into the forecast area Thursday night. The front will not make it all of the way through the area until Friday and possibly Friday night when a stronger push comes from a northern stream trough digging into the region. Showers and some thunderstorms will continue until this trough passes east of the area. With the passage of this trough, the mid levels transition into a high amplitude, blocky pattern. A closed low will develop out of the base of the trough that moves through, but there is some potential that this low then retrogrades back into the region early next week. With quite a wide range of solutions on where a closed low will occur, have stayed pretty close to the NBM for now keeping the region dry. Temperatures will remain above normal through Friday and then drop below normal over the weekend. If the closed low stays east of the area, then temperatures will rebound early next week. 06z GFS: 00z Euro: