All Activity
- Past hour
-

"Don’t do it" 2026 Blizzard obs, updates and pictures.
Greg replied to Ginx snewx's topic in New England
If one measured that fluffy snow every 6 hours, then an inflated total will be the result. Ground truth is everything. -
.thumb.jpg.aec747d13df1d95d5fed34574f74d4fd.jpg)
"Don’t do it" 2026 Blizzard obs, updates and pictures.
Vinny Findley replied to Ginx snewx's topic in New England
What part of Cranston are you in? I'm 1/2 mile from Walmart. There's over 2 feet on my street. They're big trucks with big blades but can only do so much with this amount of snow! -
2/26 - Follow-up Hopium Battlezone Storm
DDweatherman replied to DDweatherman's topic in Mid Atlantic
I know some people here aren’t bright…but today is Monday. This would be on Thursday? I thought Thursday was 3 days from Monday? -
"Don’t do it" 2026 Blizzard obs, updates and pictures.
dryslot replied to Ginx snewx's topic in New England
That would be my guess -
"Don’t do it" 2026 Blizzard obs, updates and pictures.
dryslot replied to Ginx snewx's topic in New England
Anything BM or SE that doesn’t track into the GOM thru the Bay of Fundy is a no go. -
Blizzard of 2026 Storm Thread/OBS
PhiEaglesfan712 replied to Mikeymac5306's topic in Philadelphia Region
Here you go: https://x.com/NWS_MountHolly/status/2026004588776829119 PHL - 14.0 (30.0 for the season) ACY - 16.9 Trenton - 16.4 Mt. Holly office - 20.3 -

"Don’t do it" 2026 Blizzard obs, updates and pictures.
HoarfrostHubb replied to Ginx snewx's topic in New England
Our dog absolutely haaaaaates my snowblower. So weird. It is rather quiet compared to my old gas powered one. I wonder if it gives off some frequencies that bother her. -
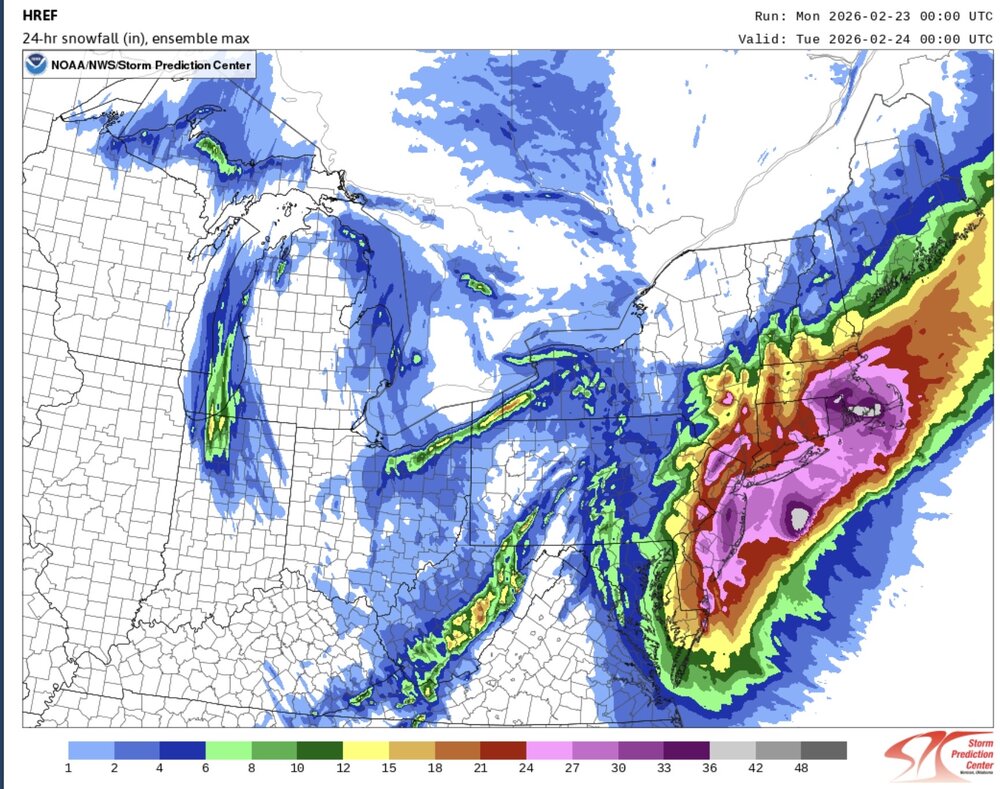
The SPC HREF had the separate band west of the Hudson idea but it verified a little further to the east.
-
"Don’t do it" 2026 Blizzard obs, updates and pictures.
RCola replied to Ginx snewx's topic in New England
Which is amazing to think how this area maximized the WWA and deformation to really bring this home. Just the right time at the right place. -
Ridiculous about schools open but expected
-

"Don’t do it" 2026 Blizzard obs, updates and pictures.
HoarfrostHubb replied to Ginx snewx's topic in New England
Yeah. It was definitely apparent early on that your hood was out of luck. -

"Don’t do it" 2026 Blizzard obs, updates and pictures.
DomNH replied to Ginx snewx's topic in New England
Snowing downwards instead of upwards in this ML fronto band finally. Too bad it's pulverized baking soda. -
That’s not hard to accomplish. Detroits only had 4 storms of 12”+ since 1932. Detroits only advantage vs the western lakes is days with snowfall. Lots and lots of 1-2” days
-
I have a Ariens 24”. It works great! I keep up with the maintenance on it and use fuel stabilizer. I use the Sno-Jet spray to prevent snow and ice accumulation in the auger and discharge shoot and it really helps when there’s a wet/shulshy snowfall.
-
-

"Don’t do it" 2026 Blizzard obs, updates and pictures.
acoolerclimate replied to Ginx snewx's topic in New England
Yeah, I'd say 78 was the biggest for North of Providence in RI, while this one was the biggest for south of Providence. -
"Don’t do it" 2026 Blizzard obs, updates and pictures.
Chrisrotary12 replied to Ginx snewx's topic in New England
Same. I legit measured 33”. Just can’t find the photographic proof. So I’ve always gone with GYX report since it agreed to what I measured. -
"Don’t do it" 2026 Blizzard obs, updates and pictures.
dryslot replied to Ginx snewx's topic in New England
lol, Hours you can’t get back. -

"Don’t do it" 2026 Blizzard obs, updates and pictures.
Ginx snewx replied to Ginx snewx's topic in New England
That's awesome still great snow here 26 probably 27 very soon. Another measure at 5 -
The upslope has been performing quite well all day (arguably over performing). It’ll be confined to a narrow strip along the higher terrain from Medina to Geauga, but it seems like spots in there will come in with 6-9” type amounts. I got close to 3” overnight, pushing my storm total to 4” as of 7am. It’s been snowing pretty good at home all day, so I’m expecting to come home to over half a foot on the ground. Not a bad event, not really an impressive setup but the upslope is really pulling it out for the favored areas.
-
Night heavy snow is a bummer just ruins it
-

"Don’t do it" 2026 Blizzard obs, updates and pictures.
Greg replied to Ginx snewx's topic in New England
Similar to the amounts just north of the city (Immediate suburbs) -

"Don’t do it" 2026 Blizzard obs, updates and pictures.
tamarack replied to Ginx snewx's topic in New England
I've lamented that storm frequently on this site. It was the 4th and last event that winter to verify at 1/8 (or less) of the lower end of the forecast range. Finally having some snow - at this rate we'll achieve a dusting by sunset. -

"Don’t do it" 2026 Blizzard obs, updates and pictures.
moneypitmike replied to Ginx snewx's topic in New England
I should have followed your lead. -

"Don’t do it" 2026 Blizzard obs, updates and pictures.
Baroclinic Zone replied to Ginx snewx's topic in New England
A personal safety request. Anyone with a sidewall vented gas appliance/heating system, check your exhausts.


