Broadening our use of the QBO
The Quasi-Biennial Oscillation (QBO) as defined by the AMS:
The QBO provides a good first-order look at the background state of the stratosphere, which can be significant for seasonal prediction. It's reliable periodicity (probably the most consistent atmospheric oscillation known today) also makes it a useful tool in forecasting.An oscillation in the zonal winds of the equatorial stratosphere having a period that fluctuates between about 24 and 30 months. This oscillation is a manifestation of a downward propagation of winds with alternating sign.
The QBO is measured by the anomaly of the winds at 30mb averaged along the equator. Here we run into the problem which is the joy with which people embrace one-dimensional indices. It is very easy to fall into the trap of calculating all sorts of statistics on these indices without any regard to the physical meaning behind them.
For as long as the QBO has been known and calculated monthly, people have been trying to determine linear correlations to all sorts of things from regional temperature anomalies to tropical cyclone activity. So first of all, many do this with complete lack of respect for the 24,000ft of vertical that divides the QBO from their backyard weather station, and no recognition of the physical relationships that can in fact draw a bridge that far.
So yes, there can be drawn physical relationships from the QBO down to sensible weather at the surface. However, not in the way everyone assumes. In fact, the relationships are probably much better than anyone realizes! This is because people only look at the number, and do not use the QBO to its full potential.
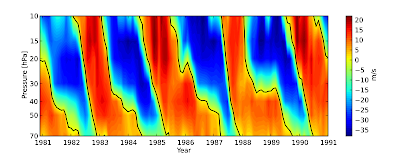
The key is in the second sentence of the AMS definition ... that the QBO is a product of the downward propagation of wind anomalies ... which can be visualized by this well-recognized time-height section:
Then remember exactly what the QBO is measuring: wind. That means a gradient by height is equivalent to wind shear. Westerly and easterly wind regimes propagating downward define the QBO, but between these regimes exists a shear zone. When one regime is descending below 30mb and the other regime is starting to develop above 30mb the QBO index is around neutral ... indicating the shear zone is around 30mb ... However there can be westerly shear and there can be easterly shear and reading a QBO of zero tells you nothing about the true state of the stratosphere.
So I am proposing that we try to expand our use of the QBO ... at the very least we can recognize it as a two dimensional index that oscillates in time and space.
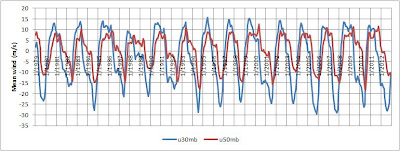
I am working to develop what I call the Multivariate QBO Index (MQI). To start things off, I have simply looked at 30mb and 50mb wind data ... which as you can see both oscillate with time with similar periodicity, with a phase shift between the two indicating the descending nature of the oscillation.
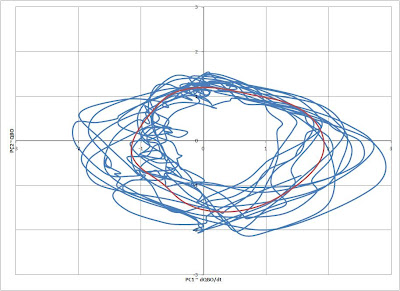
I have taken this data and computed the principle components of variance to develop two orthogonal indices. I standardized the two indices, and then plotted them in 2D phase space. You can see how consistent the path is through phase space for every period of the MQI. The red line is a Barnes-like-interpolated mean at a one-degree interval. From this method, we can analyze both amplitude and phase (TRUE phase -- not just positive or negative anymore).
PC1 plotted on the horizontal axis is similar to the shear near 30mb ... or dQBO/dt, and PC2 plotted on the vertical axis is similar to the QBO.
In order to calculate the mean, I used a cosine weighting function at one-degree intervals. Below I have plotted the resulting amplitude of the mean as a function of phase angle (in red). In blue, I have plotted the total weight by phase angle ... this gives an indication of the "residence time" of the MQI around that particular phase.
Future work...
First of all, I hope to refine this index a little by using more levels within the stratosphere.
Secondly, using this index, I plan on running statistics on various motions in the troposphere ... meaningful statistics, given information on the full QBO now.
Most of all, I anticipate a better relationship to tropical cyclone activity than has been shown in the past.


0 Comments
Recommended Comments
There are no comments to display.
Create an account or sign in to comment
You need to be a member in order to leave a comment
Create an account
Sign up for a new account in our community. It's easy!
Register a new accountSign in
Already have an account? Sign in here.
Sign In Now