


Typhoon Tip
-
Posts
44,869 -
Joined
-
Last visited
5 Followers




About Typhoon Tip

Recent Profile Visitors









-
2026-2027 Record-breaking El Nino
Typhoon Tip replied to Stormchaserchuck1's topic in Weather Forecasting and Discussion
So I'd be careful with the QBO in correlations. This actually happened first back in - I think ...- it was 2016, where the QBO abruptly and mysteriously halted ( in the relative sense... It even reversed for a time, mid cycle - something that had never been seen at that magnitude, if ever. It prompted me to check and sure enough, there's been publication as to the QBO as ( possibly ...) now also being affected by CC. Yes, even this is not unaffected. The study is “The disappearing quasi-biennial oscillation under sustained global warming,” by Fuhai Luo and colleagues, published in Nature Communications. Jan 29 earlier this year. It indeed describes the QBO as experiencing unusual disruptions in recent years. The idea here is that if it is doing this sort of "break down" ... that should enter the question as to how physically it is coupled with the total system - if so ... naturally and quite arithmetically the correlation goes with it. Just sayn' -
2026-2027 Record-breaking El Nino
Typhoon Tip replied to Stormchaserchuck1's topic in Weather Forecasting and Discussion
I don't disagree with you reasoning here and product issuance and so forth.. I would only add that the base-climate is very steep since 1997. That does sort of tilt matters from being straight up clearly attributable to ENSO. ...in terms of temperature departures down the SE ... Seasonality should also be considered - The SE could easily have fared warmer than 1997 in the absence of these warm ENSO autumns. I also have some reservation about attributes with ENSO prior to the gradient of the hemisphere drawing the El Nino into the fight. Having said that, if there's some primitive influence that's even subtle, yeah I mean there could be some synergy there that would not likely be very readily noticeable. -
2026-2027 Record-breaking El Nino
Typhoon Tip replied to Stormchaserchuck1's topic in Weather Forecasting and Discussion
You know notice I am not suggesting or saying at all, that it won't be advantageous to pattern orientation ( depending on what one wants - ) ? I'm not sure it makes a difference. That's why I said 'straw man' above. Not sure anyone's really arguing. I just don't like the untrue application/attribution thing, and I read/heard a bunch of it from 'social media celebrities' Either correlates to a favorable pattern. Think getting there via different wholesale means. I would "possssibly" argue that the bottom-->up variety is more conducive to NE Pacific heights ...but you can see how therein in drives almost no difference for the N/A continent. Contrasting, the -AO forcing from a SSW full cycle forcing has it's own variability. In 2006-2007, for example there was a very impressive SSW museum piece event, Yet, the incredible balmy historic warmth ongoing across the N/A mid latitudes actually persisted for 2 weeks longer - really - than it should have. The blocking and cold unloaded over in Russia/Siberia first, because the planetary wave # was destructively interfering the genesis of cold conveyor over on our side of the hemisphere. That changed of course...we end up with some winter in February that year... Point being, these correlators for bringing cold into mid latitudes are not single sourced, as well, can vary in and of themselves.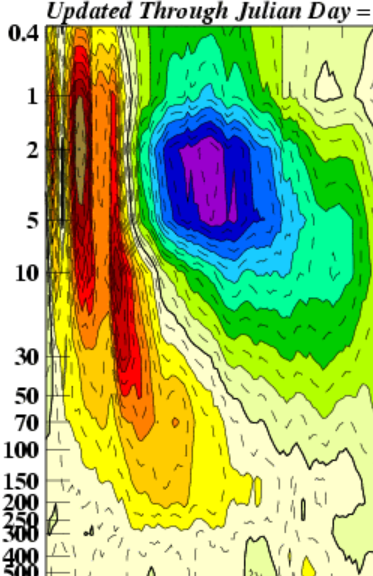
-
2026-2027 Record-breaking El Nino
Typhoon Tip replied to Stormchaserchuck1's topic in Weather Forecasting and Discussion
I realize you're just talking/rhetoric here but ... there's a non-zero order probability that when the +ENSO is finally "pattern forcing" ...what emerges is shock-and-awe. Or not ... just sayn' -
2026-2027 Record-breaking El Nino
Typhoon Tip replied to Stormchaserchuck1's topic in Weather Forecasting and Discussion
yeah I'm not attempting to 'take credit' don't give a shit. It's probably obvious to most anyway ... it was a question that popped into head back in summer actually ha. when it was 89 F -
2026-2027 Record-breaking El Nino
Typhoon Tip replied to Stormchaserchuck1's topic in Weather Forecasting and Discussion
There is no SSW modeled from what I'm seeing anyway ... Just pointing that out for the straw man if no one's betting. General readers: This exact same aspect took place over the last three consecutive latter autumns - the tropopausal heights over the N arc of the oceanic-atmospheric coupled "thermal bulge", lifted in altitude and introduced a warm anomaly between 50 and 150 hPa altitudes. This then terminates higher into the PV near the top 10 ... 5 hPa levels registering/forcing a faux split, because there is residual warmth that does get that high. But, that is bottom --> up phenomenon. SSWs are intrusions that begin above 30 hPa, and often pulse for a week before the main plume arrives -first- at the very high altitude. Then, given time, it descends in altitude... usually taking ~ 2 weeks to make that journey... As it lowers, it stabilizes the AO domain - this rises eights in the 500 to 200 hPa levels, a.k.a. blocking Now... there's definitely some lop over in physical characteristic and behaviors. It's not an all or not ... Some warm intrusions may then in turn downward propagate after the fact. Or, the bottom --> up could be in tandem with the other, making it suggestive in both direction, and difficult to parse out attribution. By and large, a text book SSW looks like this though, which I've annotated... Notable -AO correlation toward the end of January (~20 days past the onset of the total event) was extreme, and carried over into February that year.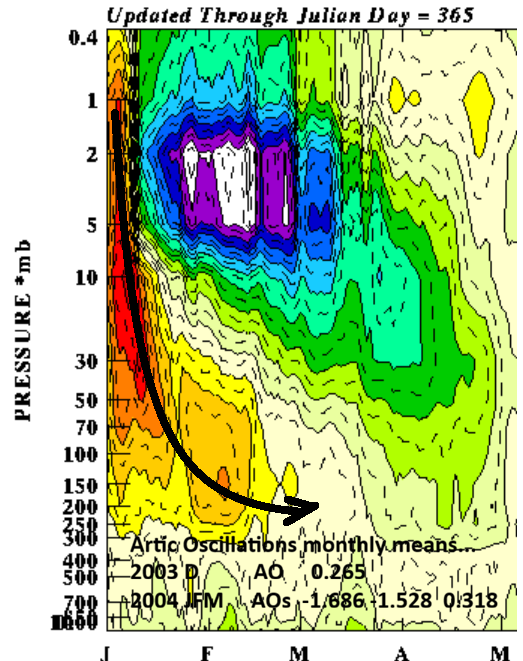
-
2026-2027 Record-breaking El Nino
Typhoon Tip replied to Stormchaserchuck1's topic in Weather Forecasting and Discussion
One aspect I've been coveting that has me deeply concerned for the state of public mental health/America Forum winter zealotry ( eh hm), is a notion that I haven't heard any one or source mention. Speculatively: the STJ may end up N of the climatological normal latitudes - as a mean ... For the general reader ... try to be nuanced aware and open idiosyncratic minded about how nature actually works for a minute here. We're talking about integrating behaviors, an integral that will end up containing examples both subtle and gross. It may not be overly obvious at all times... Sometimes yes, other times no. But in that integrated mean, could suggest a "lean" on the polar side of canonical. Events tend to go left (say). Warm penetration events a bit more robust than mid range model means - I suspect AI sources, which don't bear any compunctions ( haha ) would be unabashed. Something like that is already tantalizingly suggestive in the current Euro-AI version matter of fact... As an aside, something I'm noticing about AI so far in it's techno-infancy ... it seems to be on the amplified lean of all possibilities when looking at specifics. If whatever aspect is driving the -PDO continues, I still personally believe that needs to persist. That "tension" may be our best hope for that population of d-drippers, lest the manic state drives them to voting self-destructively for the wrong people. haha. No but (CC base +historic positive ENSO)/2) doesn't otherwise intuitively feel hopeful if operating on the hemisphere alone. -
2026-2027 Record-breaking El Nino
Typhoon Tip replied to Stormchaserchuck1's topic in Weather Forecasting and Discussion
Fwiprobablynotworth ... this ACME road-runner show quality graphic over at CPC seems to suggest there's a secondary +anomaly node ( if not primary...) situated around the 3.4 ... interestingly trying to connect to the marine heat wave going on around San Diego ... The nearby coastal cooling astride El Salvador - I suspect - is an artifact of the enhanced TC trafficking over the last 1.5 months running up just W of that area and imposing offshore SS stressing ..speculation.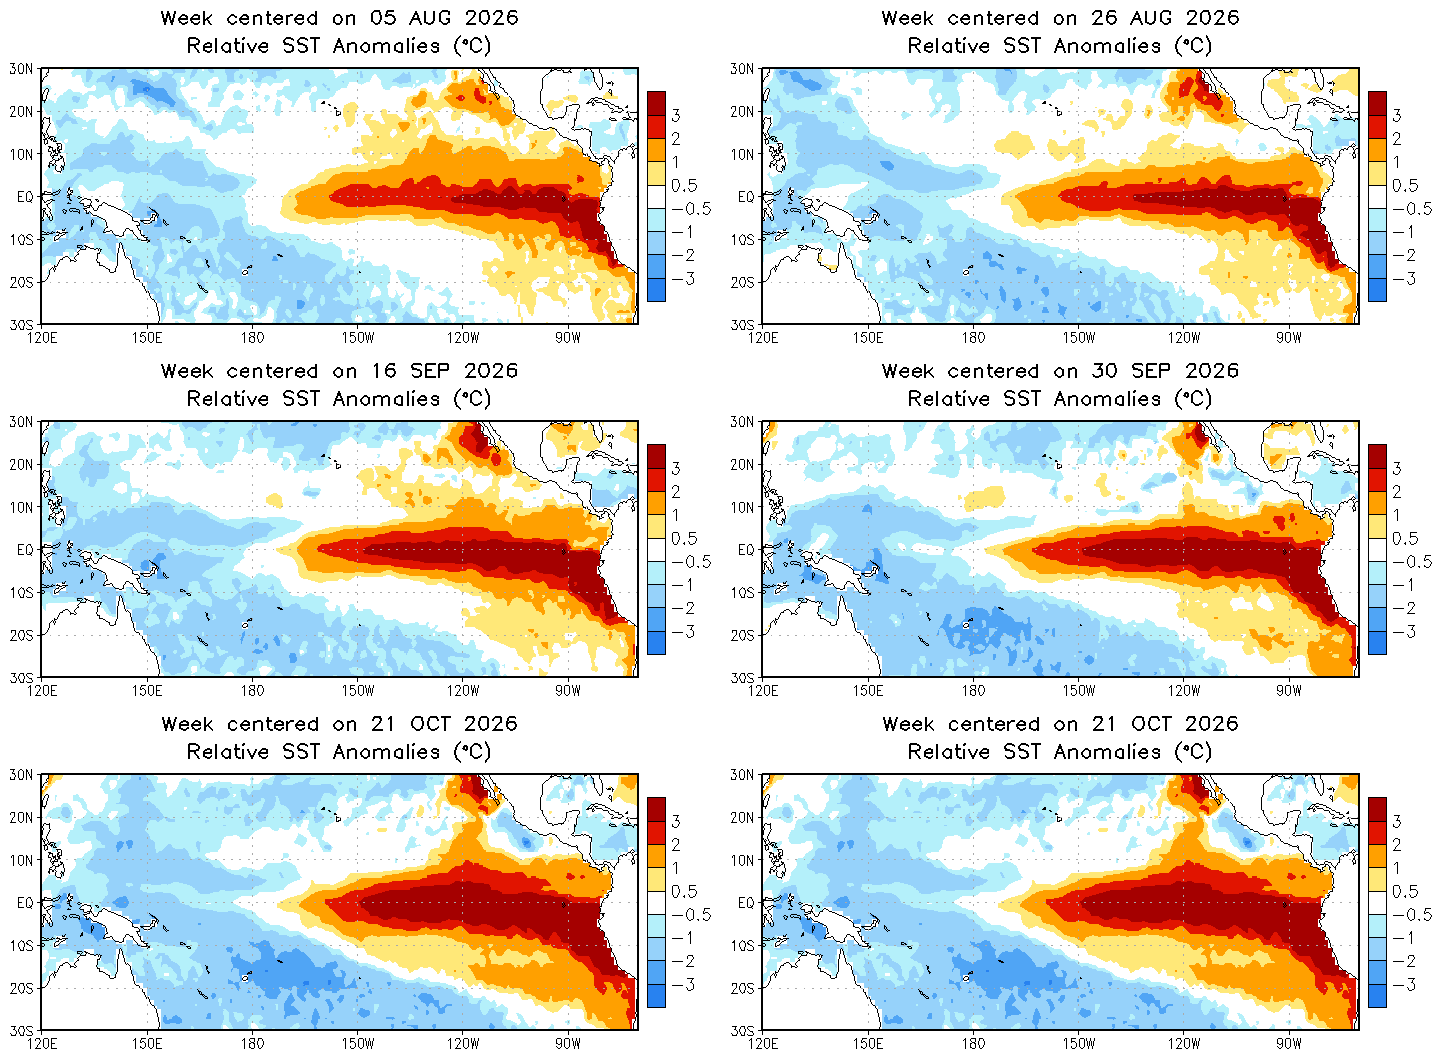
-
watch us segue from this into a 46/33 mist winter hosting three historic all-time bombs at different times ...all cutters ... wah wah waaaa
-
Yesterday boasted the grandest diurnal change I've seen 'round deez parts... 44 to 46 F swing was common within 10 miles of my location, both home stations and tweener NWS sites. [EDIT, 38-43 ...helps when you're not looking at WC columns. still impressive] Today may exceed that differential where has this cold drain phenomenon occurred.
-
It's remarkable ... the autumn of the great unbalanced RAD proficiency continues. It's 48 at ORH ap, 28 here... Granted that's 800' of difference but 20F is about as extreme a still morning difference/RAD result as I've ever seen.
-
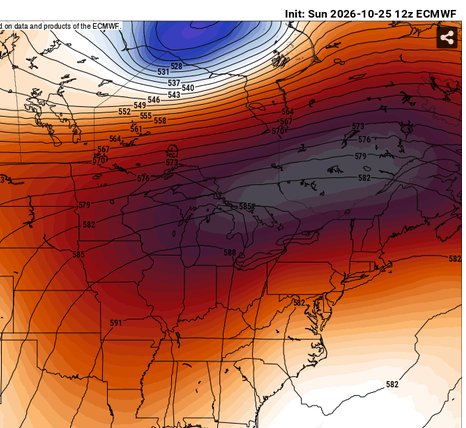
Ha! well I'm not part of that fake stuff. Temperature is temperature... I'm more focusing in on the unusual nature in which we're getting a sensible autumn out of a deep summer sky - to put it somewhat poetically. This morning the hgts are/were 582 dm ... 27 at the surface. It's been happening a lot since late summer, too. Maybe not that extreme but it's been unbalanced on the whole. If that's coincident with some discussion point than it's unintended.
-
Too early/prerequisite challenged ... but indian summer like. The trick will be, 'does the anticyclone get under our latitude?' Since mid to late August actually, these powerhouse high pressure nodes have been moving either bodily overhead of E thru Ontario, placing us persistently in a highly uncoupled lower troposphere relative to mid level soundings. We've been getting frost if not freezes under 576 dm heights - anomalous combination of metrics. Very much so... We've had hyper proficient RAD events as of late, which is an interesting met phenomenon probably under the nose of most people's awareness. It feels like we're getting a normal autumn progression - though with modest positive biases, but it's kind of been lying? so to speak. 27 F under while this; is just another example in many
-
We just went through this last year, and the year before in the late autumn early winter. Just wanna make it clear, these early PV irregularities are are not related to SSW events.
-
2026-2027 Record-breaking El Nino
Typhoon Tip replied to Stormchaserchuck1's topic in Weather Forecasting and Discussion
Not speaking for anyone in particular but ... I 'sense' the posts are implicitly dancing around an ominous look/portents for winter.

